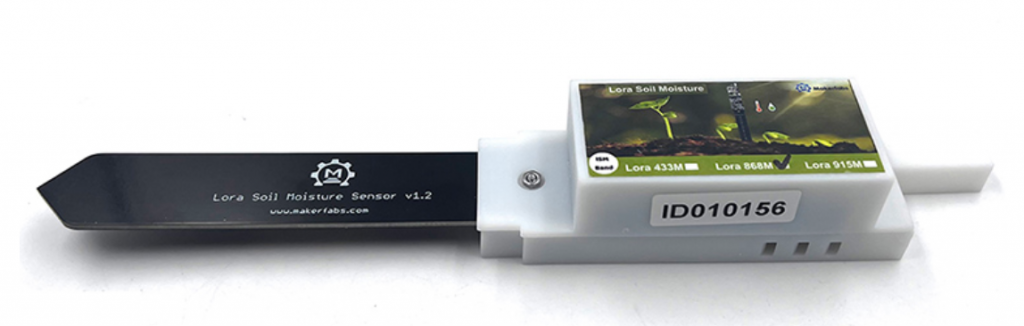
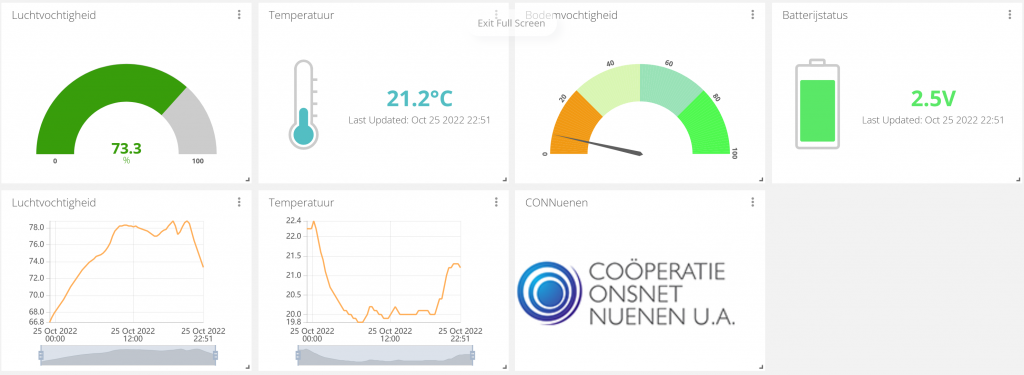
In deze instructie sluiten we een kant-en-klare sensor aan op The Things Network en presenteren de resultaten op een dashboard van Ubidots. Uiteindelijk ziet er dat zo uit:
Mocht je nog geen account hebben kies dan voor ‘Sign up for free’. Geef een gebruikersnaam, e-mailadres en twee mail een wachtwoord. Bevestig daarna je account via de mail de je ontvangt. Mocht je al een account hebben, dan is dit account te gebruiken. Log nu in met je account.
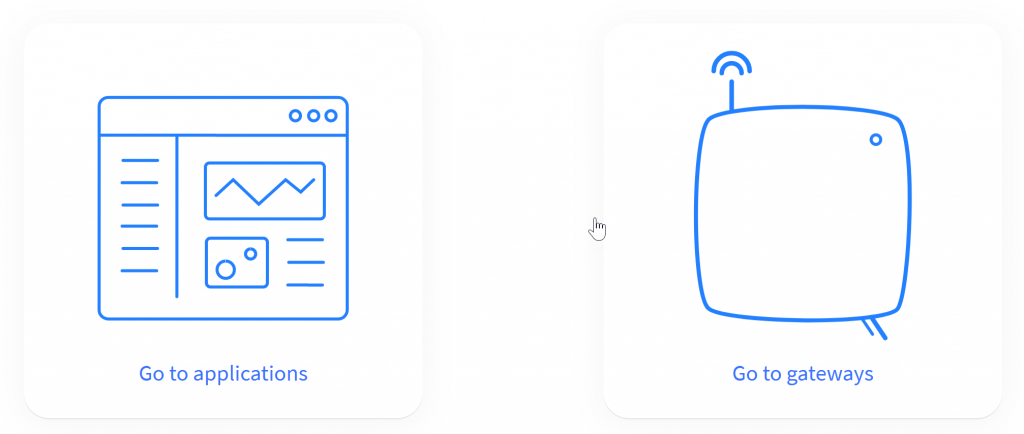
Kies in het hoofdscherm voor ‘Go to applications’
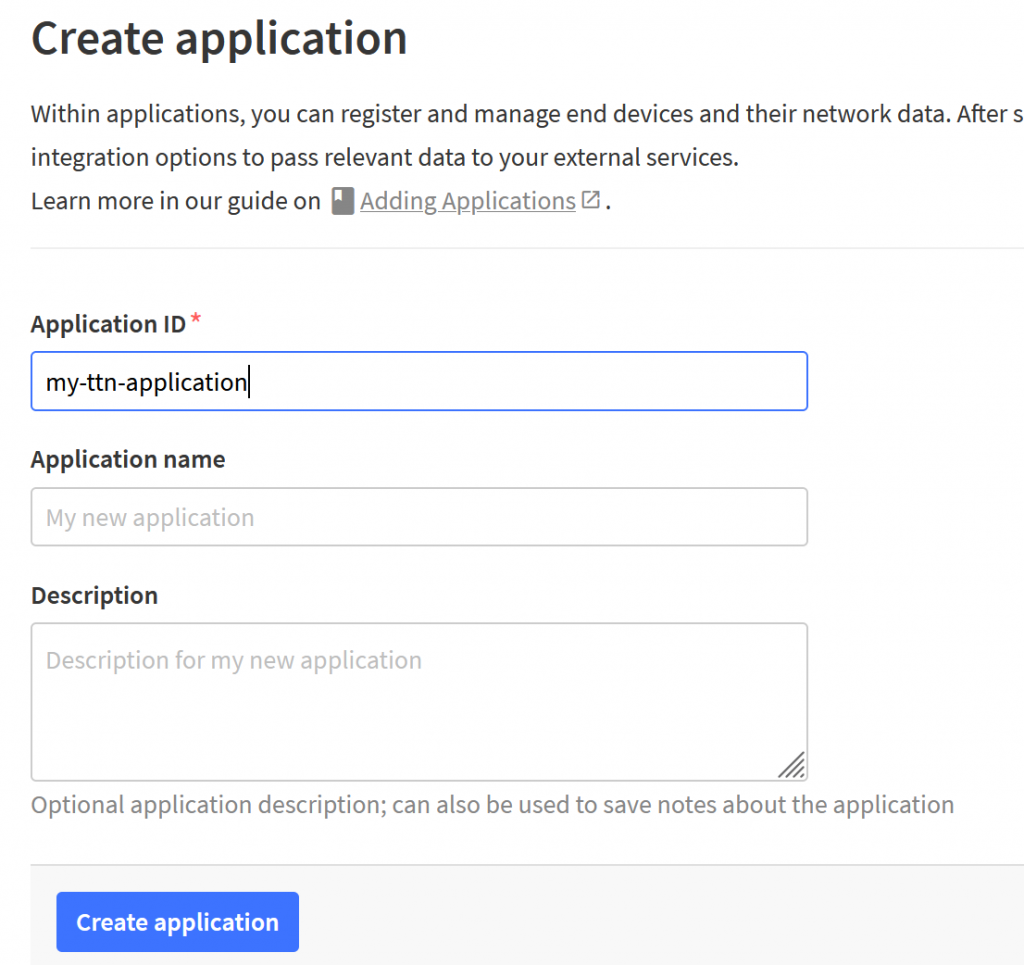
Kies voor ‘+ Add application’, geef de application een naam (let op, deze naam moet uniek zijn, mag alleen kleine letters of cijfers en een ‘-‘ bevatten (geen spaties dus) en kies voor ‘Create application’. Voeg bij deze naam bv een postcode of andere code, zodat deze meer kans maakt om uniek te zijn. Mocht de naam reeds bestaan volgt een waarschuwing.
Voorbeelden:
sensors-b25
mijn-sensoren-5612
sensor11
grondwatersensoren-12
Open nu de applicatie en kies voor ‘+ Add end device’.
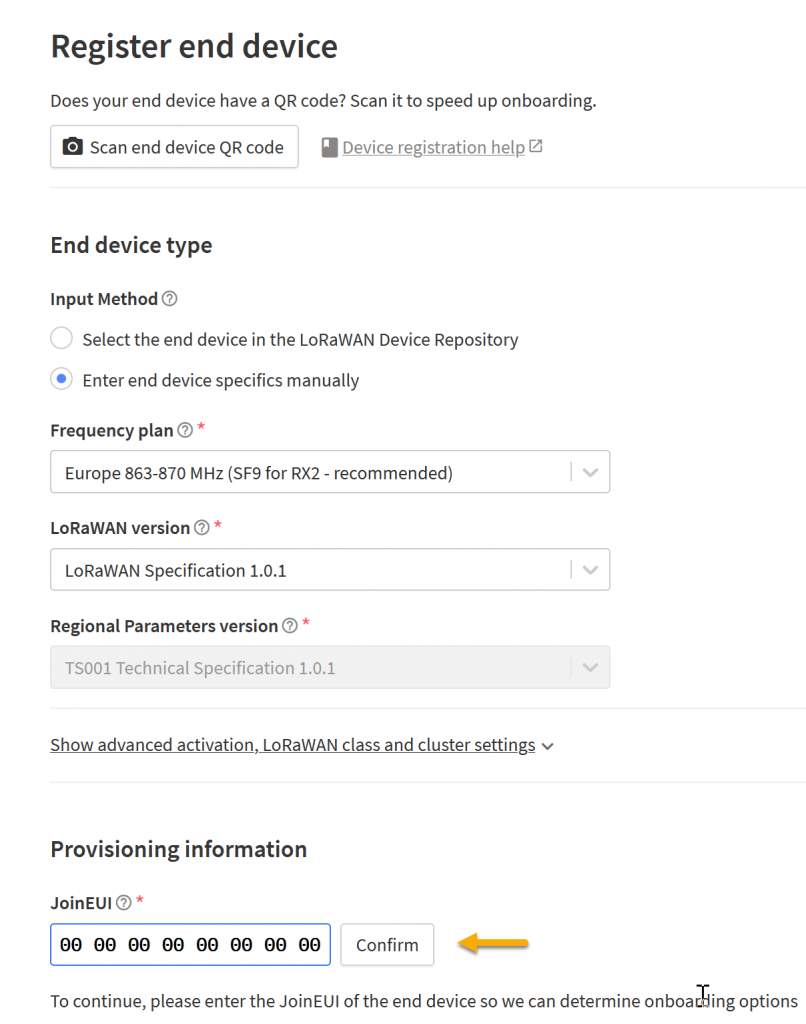
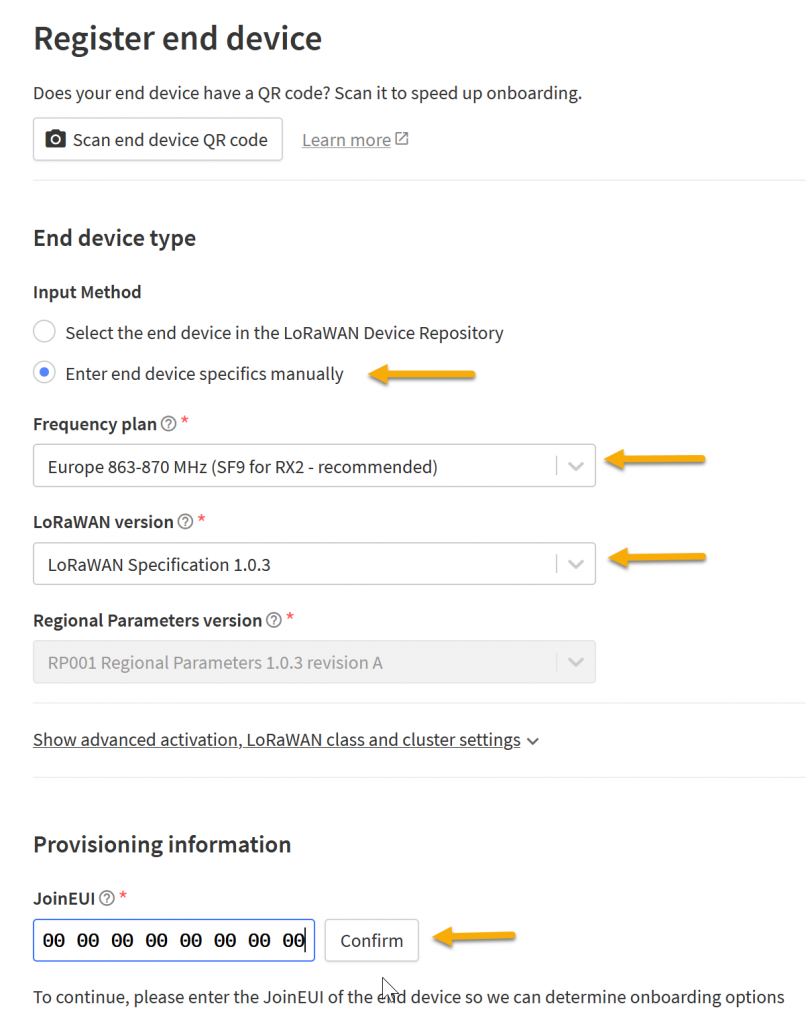
‘Enter device specifics manually’
‘Frequency plan Europe 863-870Mhz (SF9 for RX2 – recommended)’
‘LoRaWan version 1.0.3’
JoinEUI: 00 00 00 00 00 00 00 00 (daarna ‘Confirm’). Nu komt er een invulmogelijkheid voor DevEUI en AppKey
LoRaWAN device
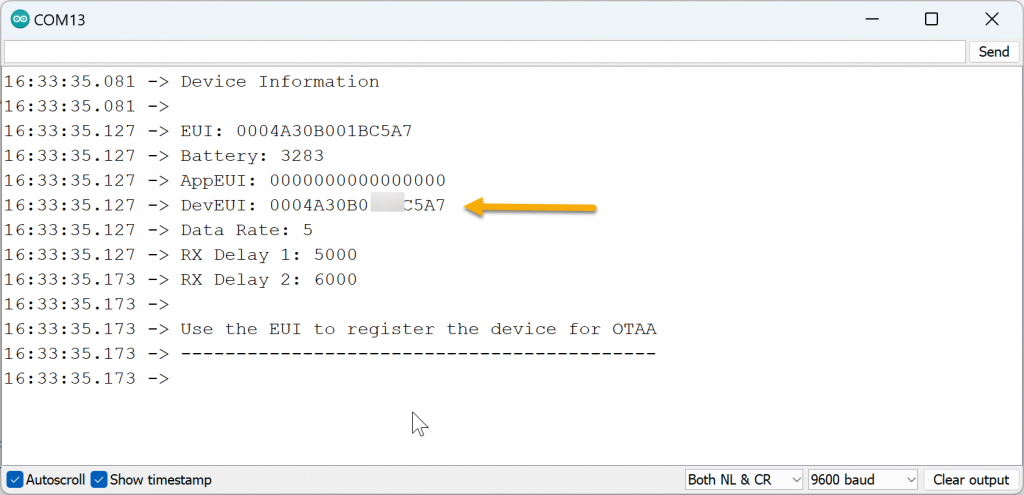
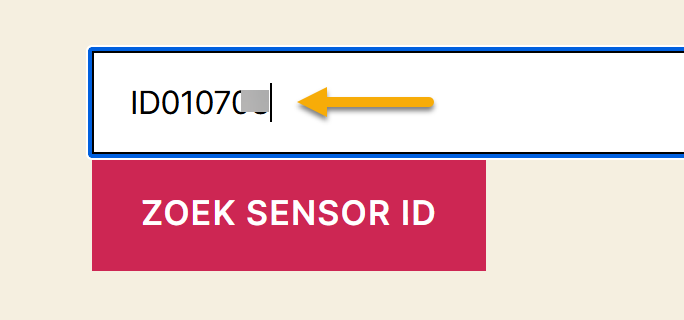
Vul nu hieronder het ID nummer (inclusief ID) in wat op de batterijhouder van de gebruikte sensor staat
Sensor ID
File: /wp-content/uploads/2022/11/deveui-compleet.csv not found. Only support for local files.
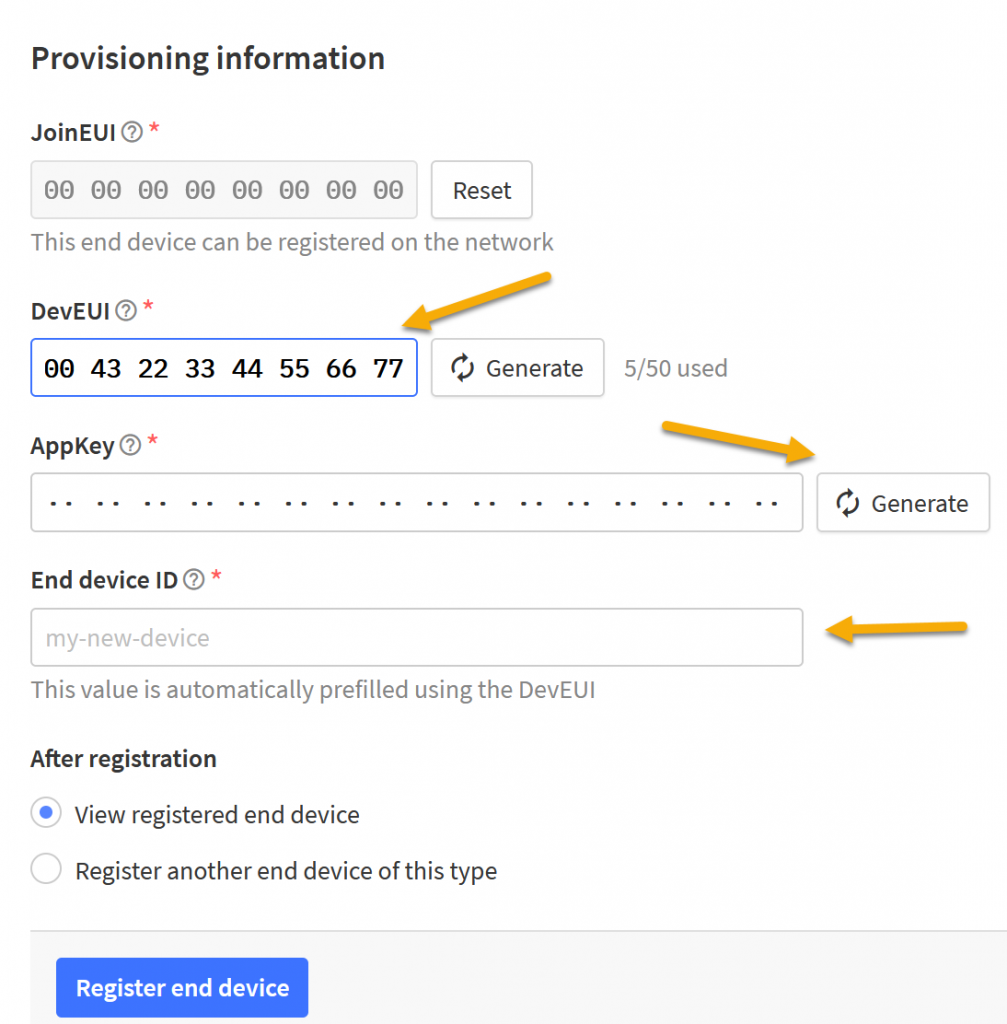
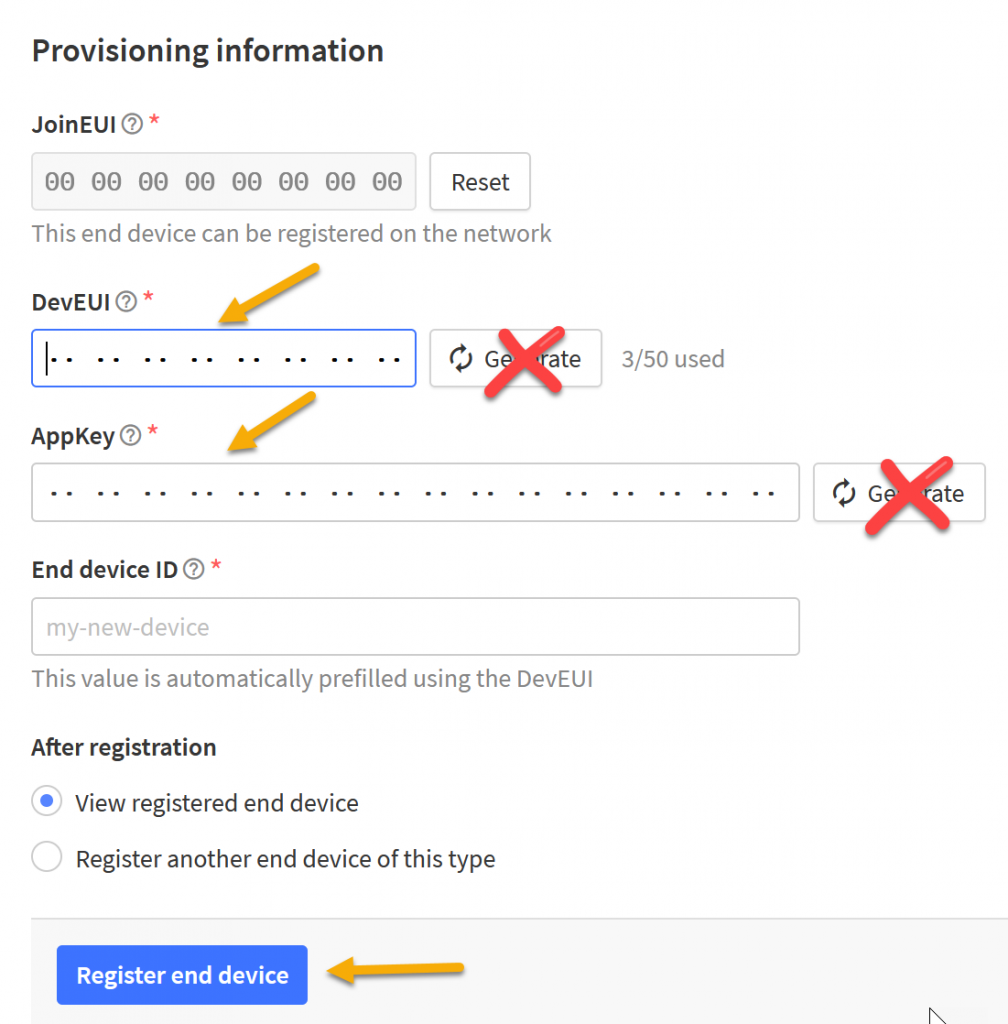
Kopieer de DevEUI over zoals hierboven. Deze code is uniek voor je node. Je kunt deze code met CTRL-C, CTRL-V plakken in het DevEUI-veld.
Neem ook de AppKey over en plak deze in het AppKey-veld.
Gebruik NIET de ‘Generate’ knop, de waarde wordt dan weer vervangen!
De naam van de sensor wordt automatisch ingevuld op basis van de DevEUI.
Sla de gegevens op met ‘Register end device’. De sensor is nu bekend bij The Things Network.
Provisioning
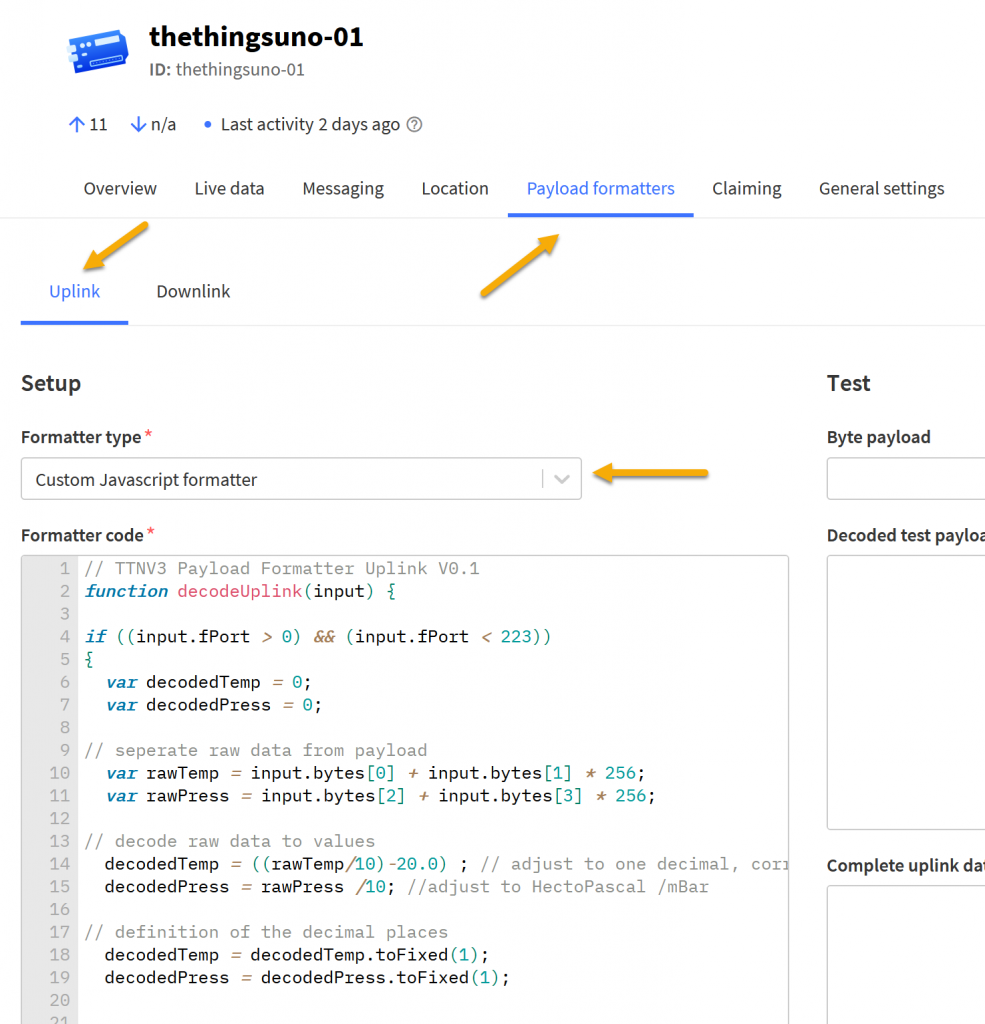
Om de data die de sensor verstuurt te vertalen naar leesbare meetwaarden maken we gebruik van een ‘Payload Formatter’, een klein stukje code wat het bericht vanuit de sensor decodeert.
Kies in de menubalk voor ‘Payload Formatter’, en daarna voor ‘Custom Javascript’ bij uplink. Kopieer onderstaand stukje code en plak dit over de aanwezige code.
// TTNV3 Payload Formatter Uplink V0.1
function decodeUplink(input) {

if ((input.fPort > 0) && (input.fPort < 223))
{
  var decodedSoil = 0;
  var decodedTemp = 0;
  var decodedHumi = 0;
  var decodedBatt = 0;

// seperate raw data from payload
  var rawSoil = input.bytes[0];
  var rawTemp = input.bytes[1] + input.bytes[2] * 256;
  var rawHumi = input.bytes[3] + input.bytes[4] * 256;
  var rawBatt = input.bytes[5] + input.bytes[6] * 256;

// decode raw data to values
  decodedTemp = sflt162f(rawTemp) * 100; // value calculated to range -1..x..+1 by dividing /100
  decodedHumi =  sflt162f(rawHumi) * 100; // value calculated to range -1..x..+1 by dividing /100
  if (rawBatt !== 0) decodedBatt =   rawBatt / 1000; // batterie voltage ist transmitted in mV, recalculate in V

// definition of the decimal places
  decodedSoil = rawSoil.toFixed(0);
  decodedTemp = decodedTemp.toFixed(2);
  decodedHumi = decodedHumi.toFixed(2);
  decodedBatt = decodedBatt.toFixed(2);

// return values
  return {
    data: {
      Soil: decodedSoil,
      Temperature: decodedTemp,
      Humidity: decodedHumi,
      Battery: decodedBatt
          },
    warnings: [],
    errors: []
  };
}
else {
    return {
      data: {},
      warnings: [],
      errors: ["Invalid data received"]
    };

}
}

function sflt162f(rawSflt16)
{
// rawSflt16 is the 2-byte number decoded from wherever;
// it's in range 0..0xFFFF
// bit 15 is the sign bit
// bits 14..11 are the exponent
// bits 10..0 are the the mantissa. Unlike IEEE format,
// 	the msb is transmitted; this means that numbers
//	might not be normalized, but makes coding for
//	underflow easier.
// As with IEEE format, negative zero is possible, so
// we special-case that in hopes that JavaScript will
// also cooperate.
//
// The result is a number in the open interval (-1.0, 1.0);
//

// throw away high bits for repeatability.
rawSflt16 &= 0xFFFF;

// special case minus zero:
if (rawSflt16 == 0x8000)
	return -0.0;

// extract the sign.
var sSign = ((rawSflt16 & 0x8000) !== 0) ? -1 : 1;

// extract the exponent
var exp1 = (rawSflt16 >> 11) & 0xF;

// extract the "mantissa" (the fractional part)
var mant1 = (rawSflt16 & 0x7FF) / 2048.0;

// convert back to a floating point number. We hope
// that Math.pow(2, k) is handled efficiently by
// the JS interpreter! If this is time critical code,
// you can replace by a suitable shift and divide.
var f_unscaled = sSign * mant1 * Math.pow(2, exp1 - 15);

return f_unscaled;
}
Kies voor ‘Save changes’.
Controle van de sensor
Sensor
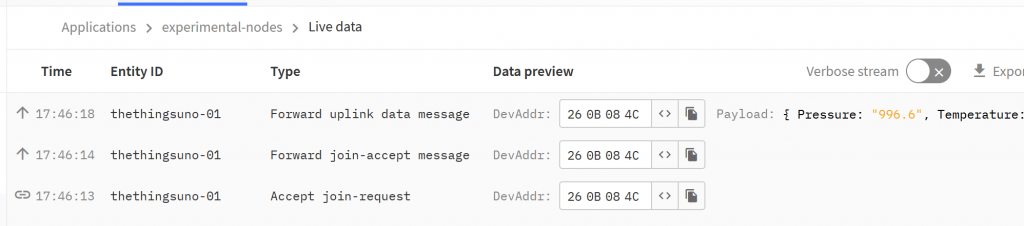
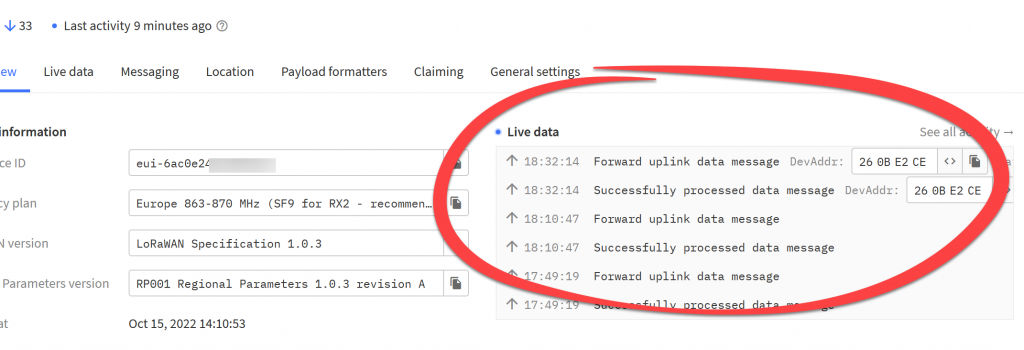
Stop de batterijen in de sensor (let op de polariteit!). De sensor zal direct starten en meteen de eerste data verzenden. Bij de menukeuze ‘Live data’ is eerst te zien dat de sensor zich aanmeldt, en daarna zal hij de eerste data versturen. Door op het kleine reset knopje te drukken is dit proces nogmaals te starten.
Live data
Foutopsporing
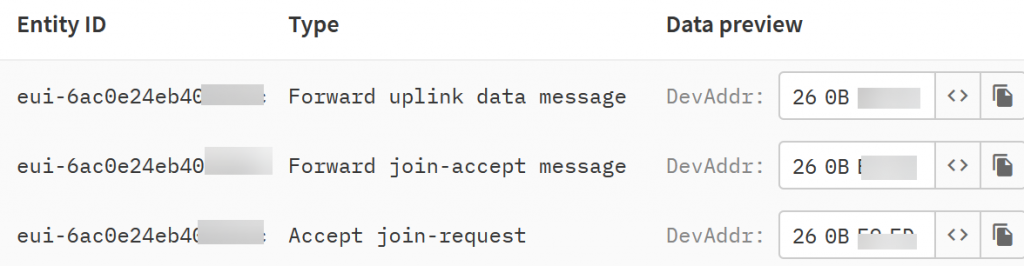
Bij ‘Live data’ kun je zien of de sensor iets verstuurd. De eerste stap is ‘Accept Join-request’. Mocht de sensor daarna niet meer reageren, dan ontvangt deze geen signaal van de gateway. Dit wordt veroorzaakt door de (te grote) afstand tussen sensor en gateway. Probeer de sensor op een hoger punt (1e verdieping) of buiten met ‘zicht’ op een gatewaylocatie.
Join request
Mocht het scherm ‘Live Data’ geheel leeg blijven, dan kan dat veroorzaakt worden door een blokkade in de PC bijvoorbeeld door een virusbeschermer. Probeer het op een andere PC, of schakel (tijdelijk) de virusbescherming uit indien mogelijk.
Datavisualisatie
Het tonen van de ‘livedata’ is aardig voor de techniek, maar heel praktisch is het niet. Daarom maken we gebruik van een visualisatieplatform om mooie plaatjes te tonen. Er zijn legio platformen, voor deze toepassing maken we gebruik van ‘Ubidots’. Ubidots is relatief eenvoudig te koppelen met The Things Network, heeft een intuïtieve gebruikersinterface en de plaatjes zien er goed uit. Daarnaast is het voor hobbygebruik gratis, en is er een mogelijkheid om berichten te sturen bij het optreden van bepaalde condities (zoals te lage bodemvochtigheid).
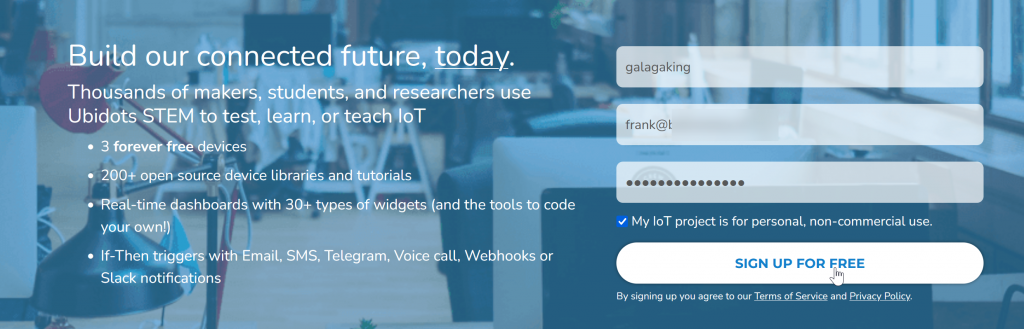
Ga naar Ubidots, vul een gebruikersnaam, mailadres en wachtwoord in, bevestig privé gebruik en klik op ‘Signup for free’.
Aanmaken account
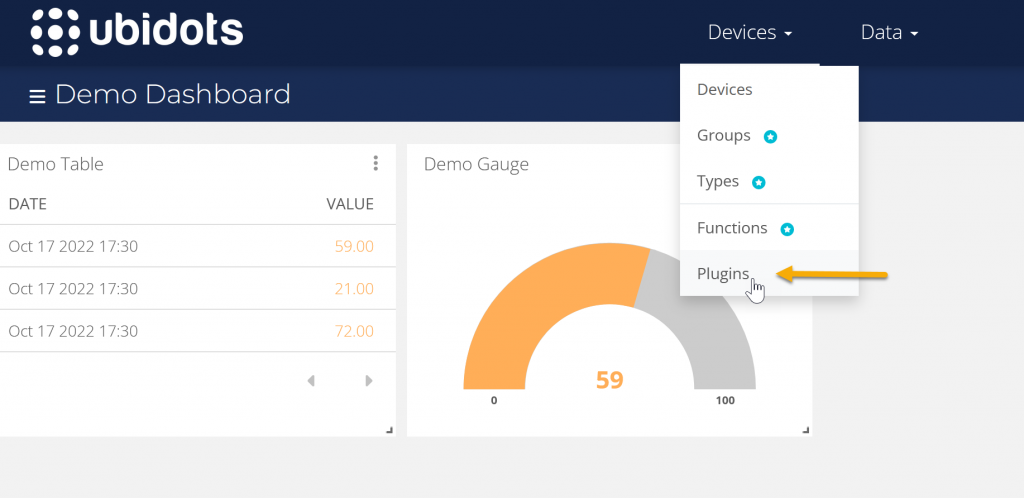
Na wat schermen met de mogelijkheden, waar met ‘Next’ doorheen te klikken is, kom je in het demo-dashboard.
Plugin TTN
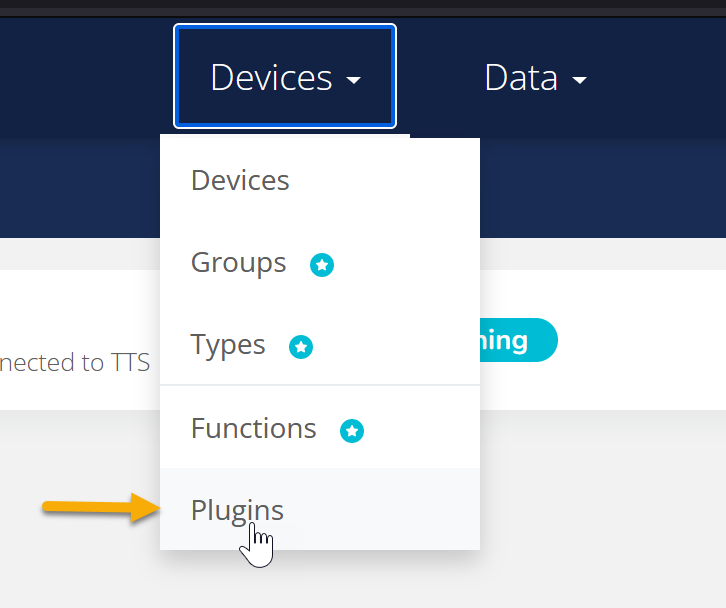
Nu moet er een verbinding gelegd worden tussen Ubidots en TTN. Hiervoor moet eerst aan de kant van Ubidots een ‘Plugin’ geinstalleerd worden. Ga naar ‘Devices’ in het bovenste menu en kies daar ‘Plugins’.
Ubidots Plugins
Bij het tussenscherm klik op ‘Create Plugin’
Plugins
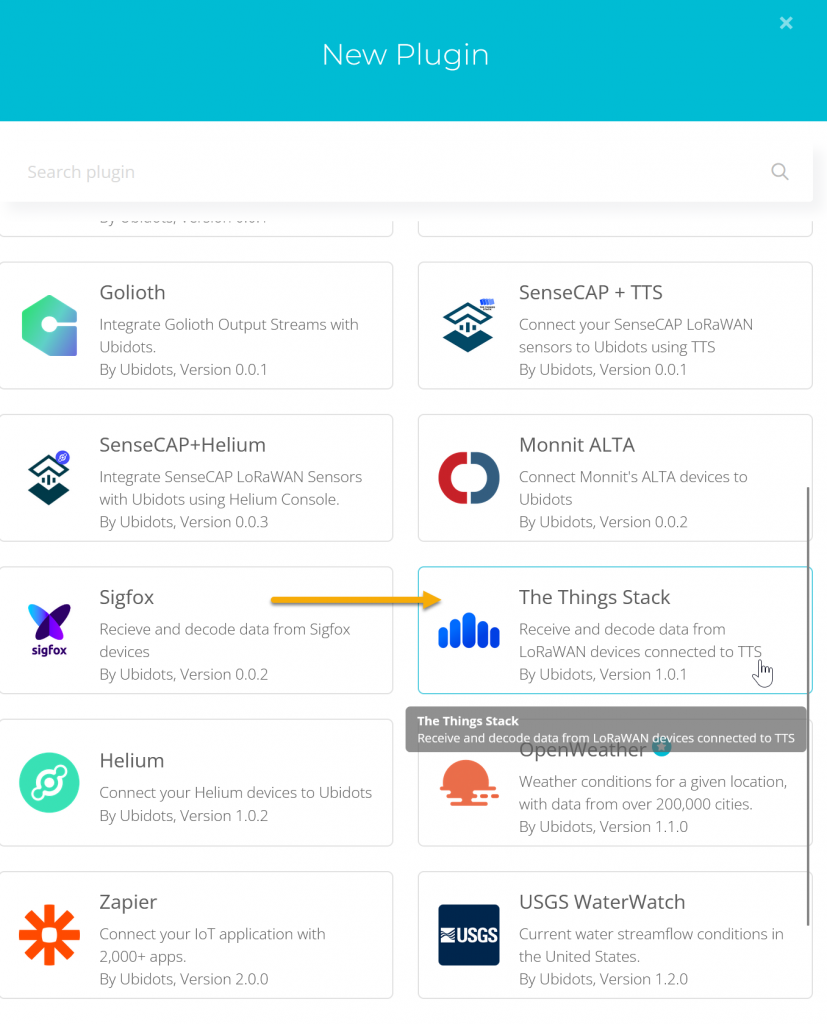
Zoek in de lijst met Plugins ‘The Things Stack’, en selecteer deze.
The Things Stack – plugin
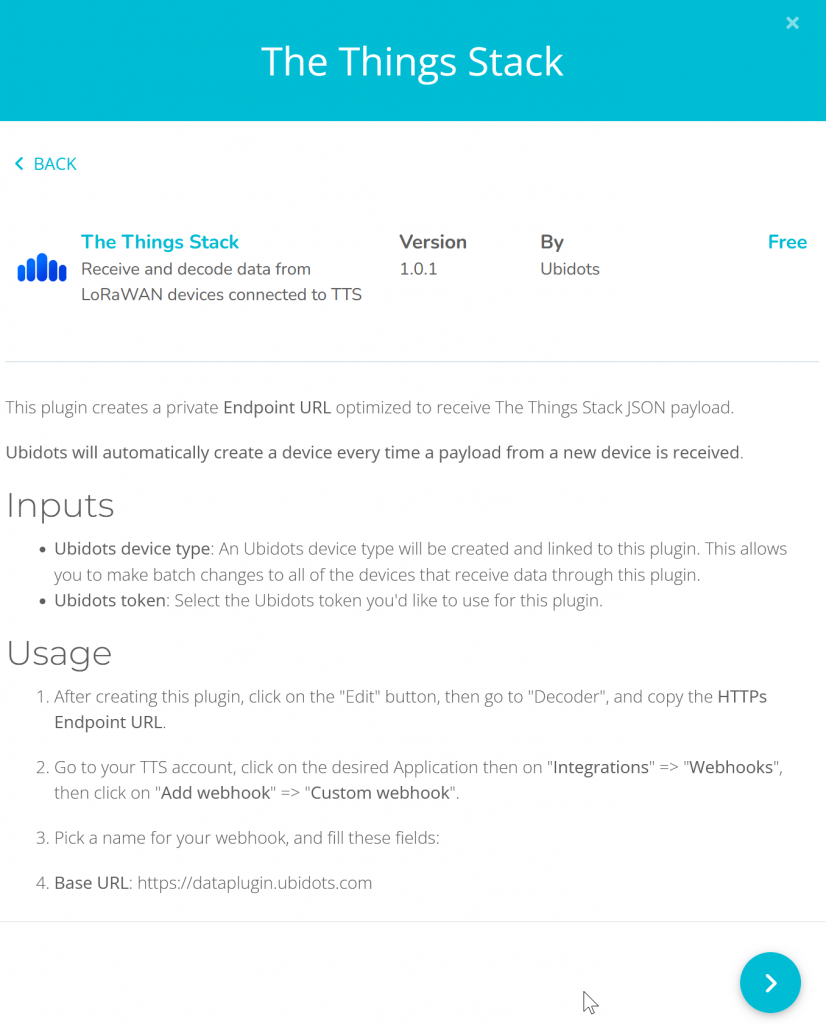
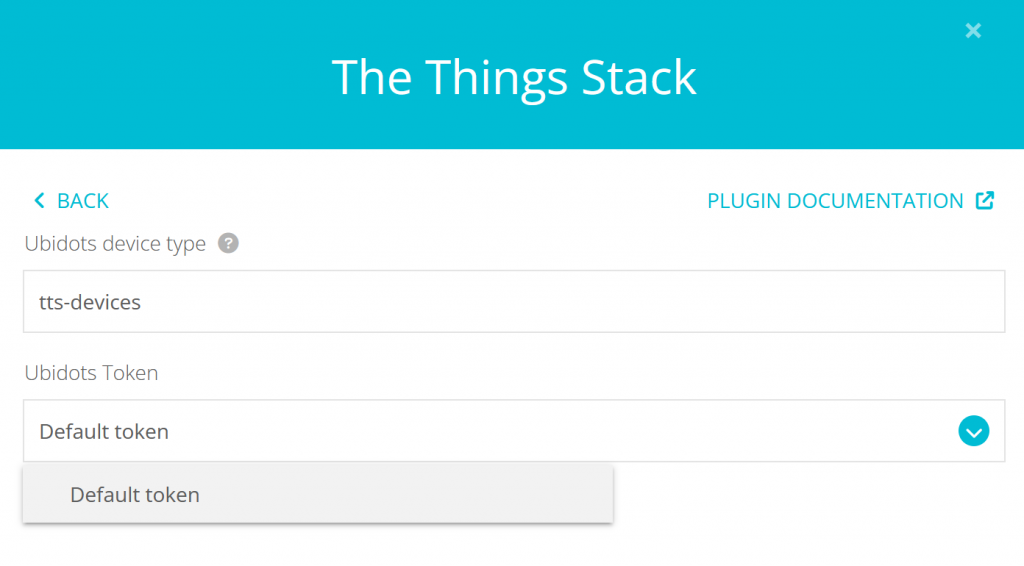
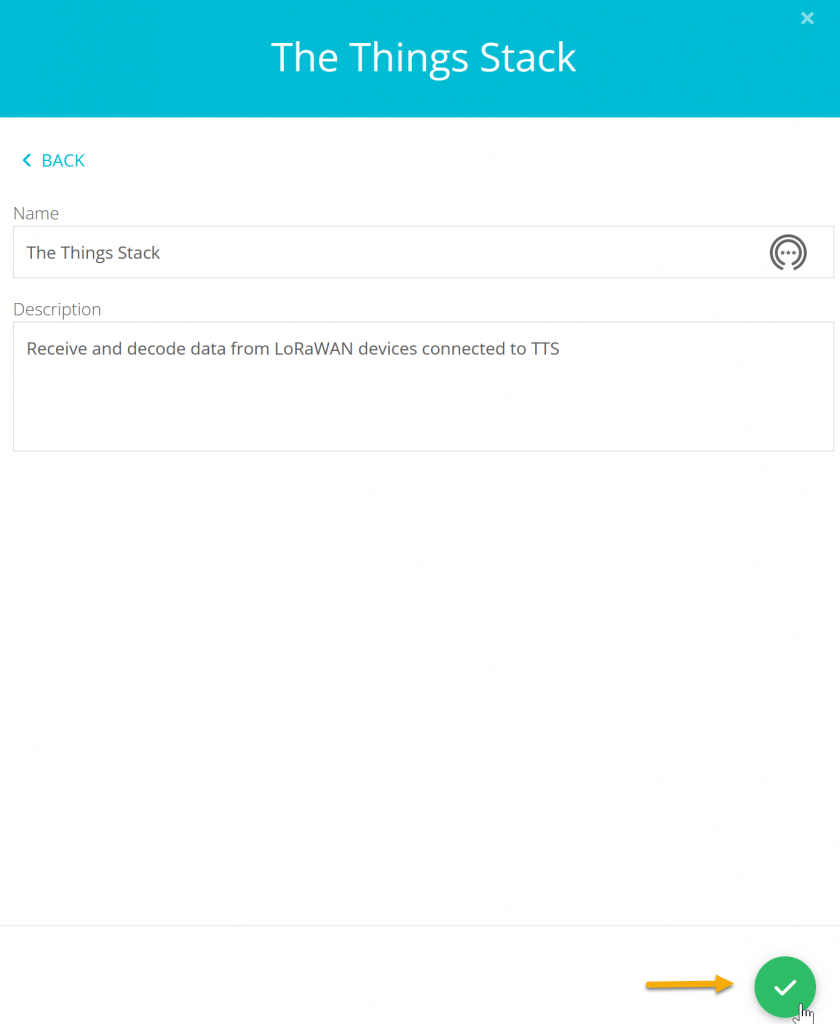
Kies daarna voor het pijltje rechtsonder. Selecter ‘Default Token’:
The Things Stack
Selecter ‘Default Token’:
Daarna weer pijltje rechtsonder, en in het laatste scherm het groene vinkje om de instellingen van de Plugin af te ronden.
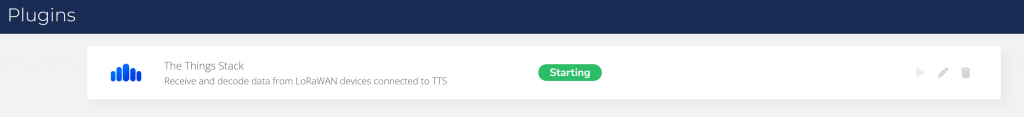
Nu wordt de Plugin gestart.
Plugin gestart
Koppelen TTN
Let op bij de volgende stappen!
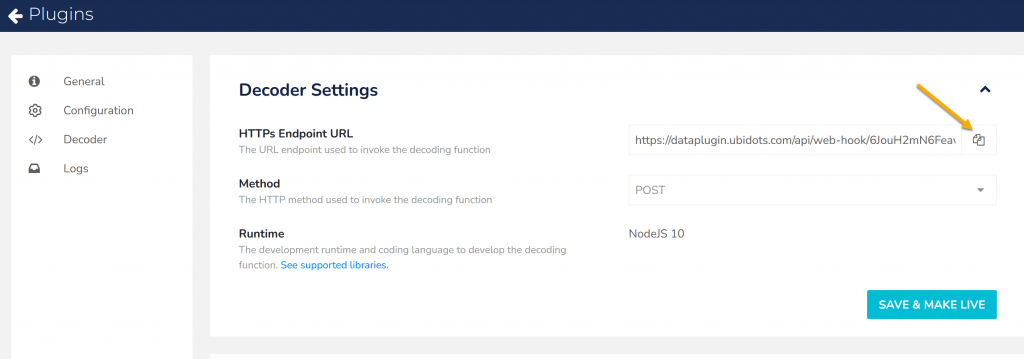
In het scherm met de plugin kies voor het ‘Edit’ icoontje (pennetje)
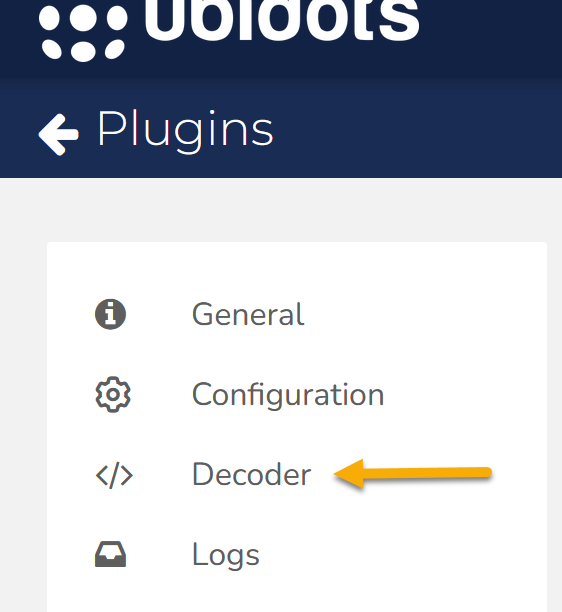
Ga in het volgende menu naar ‘Decoder’
Endpoint URL
Kopieer met het kopieersymbool de link van het Endpoint (stukje wat begint met https://dataplugin…)
Klik op ‘Save & Make Live’ (anders start de Plugin niet!)
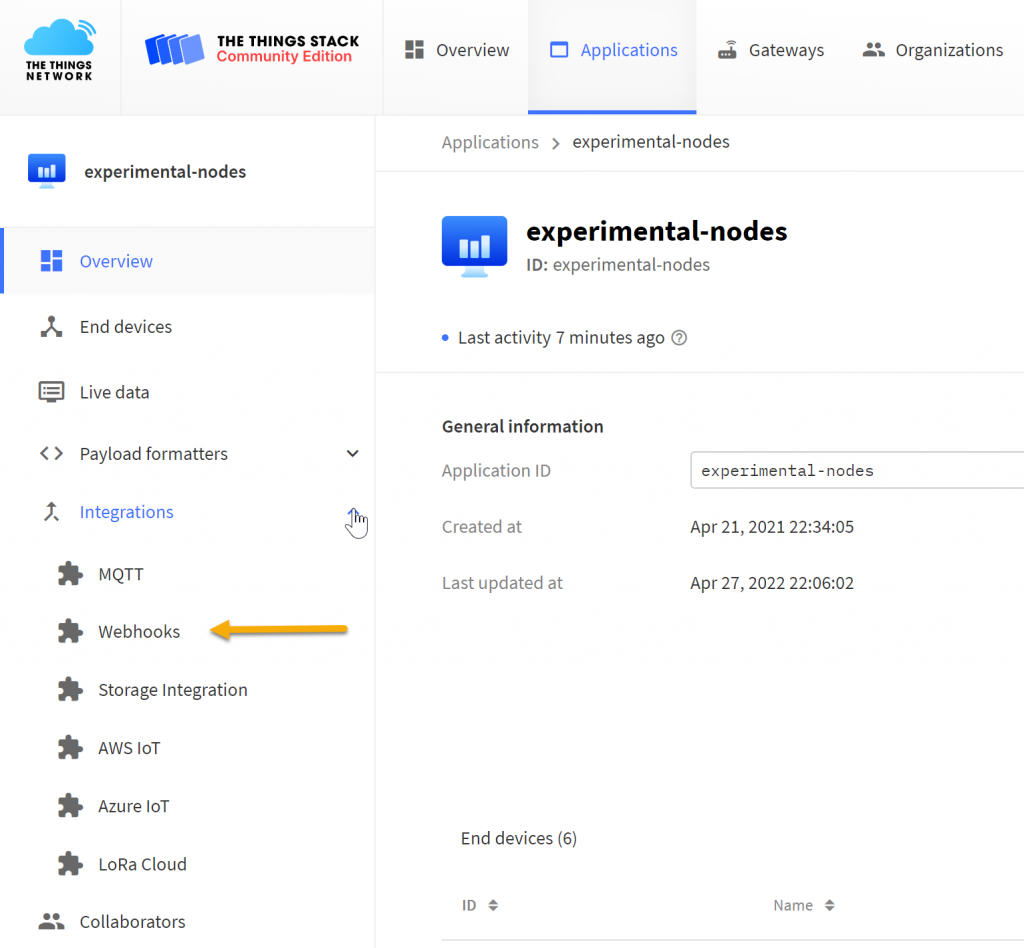
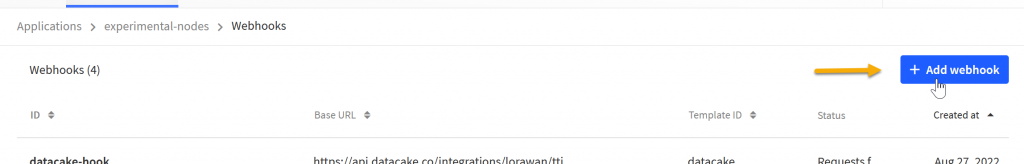
Ga nu naar de TTN console, kies in het application scherm voor ‘Integrations’ in de linker balk, en daarna voor ‘webhooks’.
Met ‘+Add webhook’ komt een lijst van mogelijke integraties. Kies ‘Ubidots’.
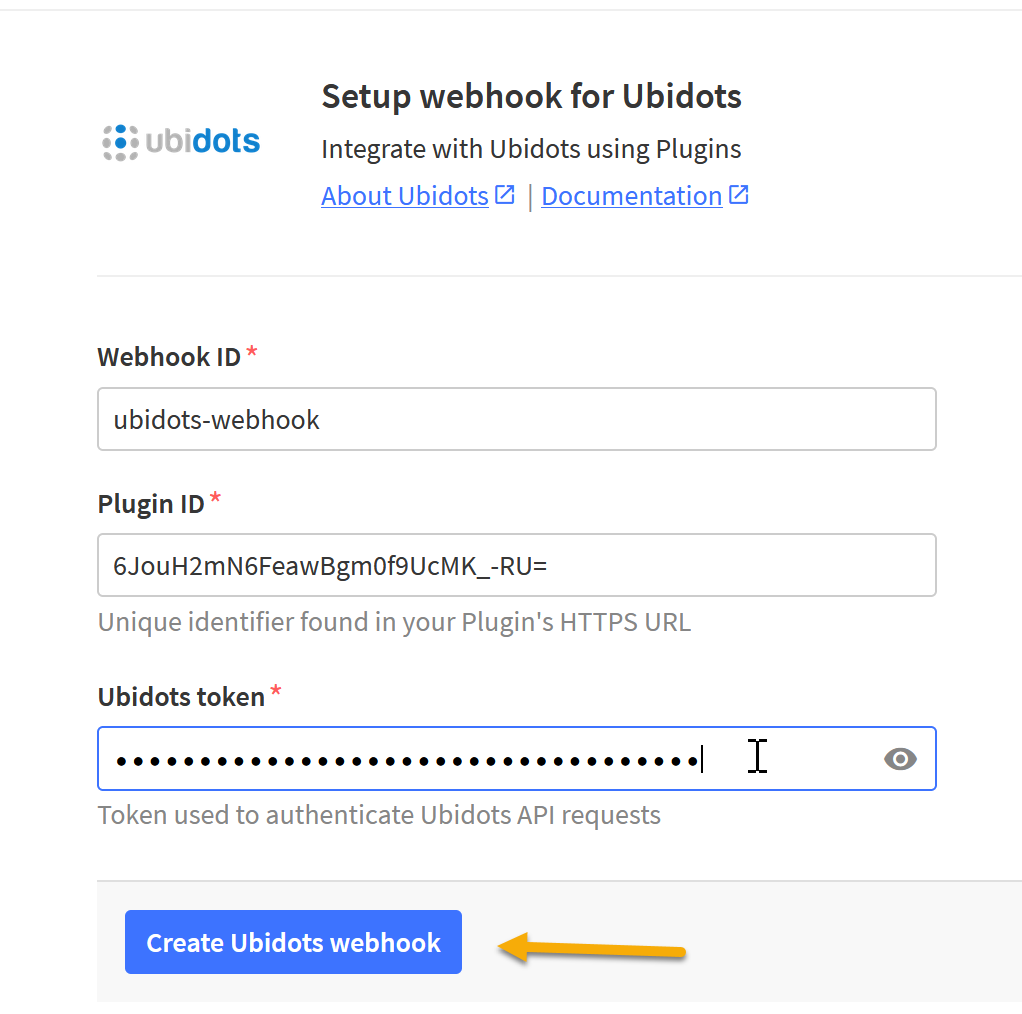
Geef de webhook een naam (‘my-webhook-ubidots’)
Webhook
Plak de link van het endpoint in het veld ‘Plugin ID’, hier is echter alleen de laatste code van belang. Alles tot en met webhook/ mag hier verwijderd worden, zodat alleen de Plugin ID code overblijft.
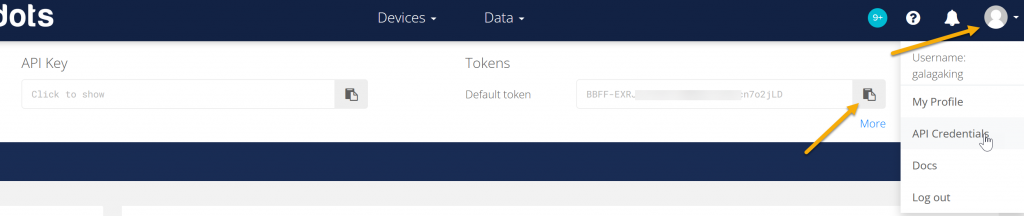
Nu weer terug naar de Ubidots interface om het Token op te halen. Klik hiervoor rechtsboven op het poppetje, kies voor ‘API Credentials’. Rechts in het scherm kun je het token zichtbaar maken en daarna kopiëren met het kopieer symbool.
Token
Weer terug naar de TTN Console, plak de code in het veld ‘Ubidots Token’. Klik op ‘Create Ubidots webhook’ om de webhook aan te maken en daarmee verbinding te leggen tussen TTN en Ubidots.
Create webhook
Ga nu naar het scherm met de plugins van Ubidots:
Plugins
Klik nu op het pennetje van de aangemaakte plugin:
Plugin The Things Stack
Kies in het linkermenu voor ‘Decoder’:
Plugin Decoder
Voeg in dit venster onderstaande aangepaste decodercode toe, vervang de oude code door deze in zijn geheel te selecteren en te vervangen door onderstaande.
async function formatPayload(args) {
  var ubidots_payload = {};

  // Get uplink's timestamp
  ubidots_payload['timestamp'] = new Date(args['uplink_message']['received_at']).getTime();

  // Already decoding in TTS using payload formatters, so use this decoded payload:

  var decoded_payload = args['uplink_message']['decoded_payload'];

  // Merge decoded payload into Ubidots payload
  Object.assign(ubidots_payload, decoded_payload);
  return ubidots_payload
}
module.exports = { formatPayload };
Sla de aangepaste decoder op met ‘Save & Make Live’:
Save decoder
De verbinding start niet altijd direct, en moet soms gereactiveerd worden. Dat is mogelijk in het overzichtsscherm van de webhooks van TTN.
De datastroom
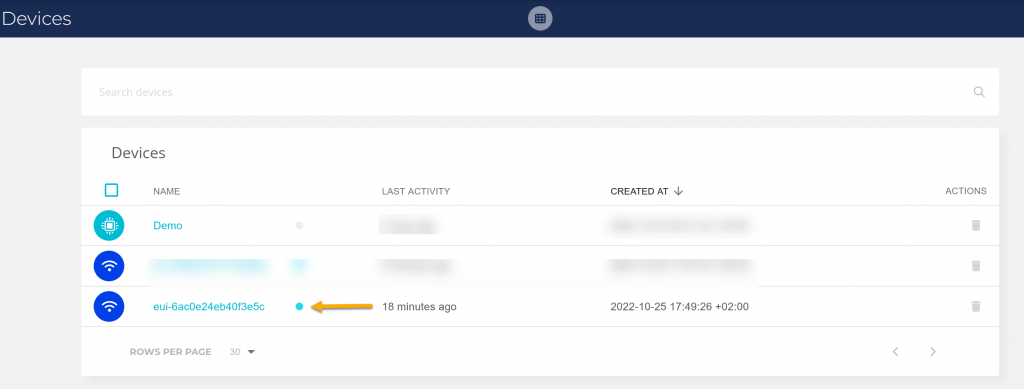
Bij het verzenden van het eerste bericht zal automatisch een device aangemaakt worden binnen Ubidots. Dit proces kan geforceerd worden door de sensor even te resetten, immers zal deze dan direct data verzenden.
Devices
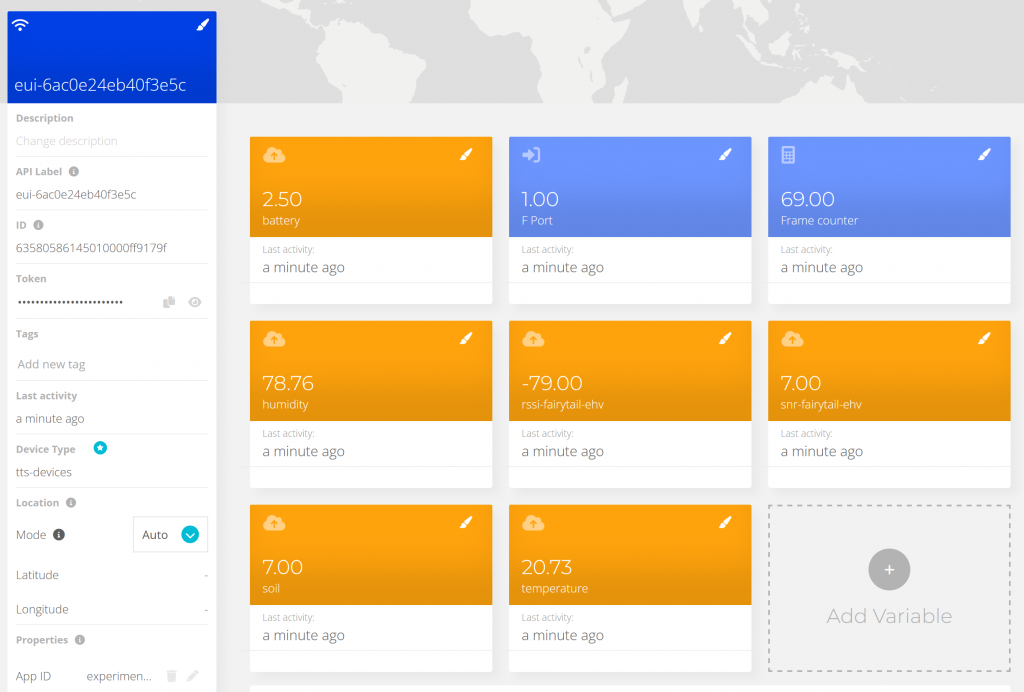
Standaard krijgt het device de naam zoals deze in TTN bekend is. Klik op het device. Nu worden alle waarden weergegeven zoals deze de eerste keer zijn ontvangen van de sensor.
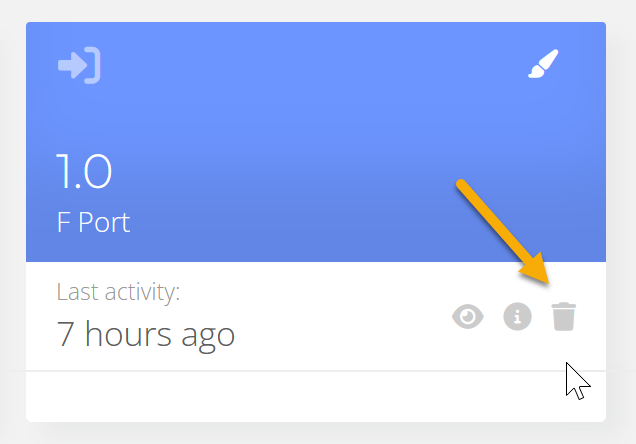
De originele ‘decoder functie’ zal meer waardes weergeven. Er geldt een maximum van 10, dus het kan voorkomen dat daardoor de sensor waardes er niet meer bij komen. Verwijder daarom alle niet relevante waardes met het prullenbakje (dit zijn de rssi / snr waardes van de gateways bijvoorbeeld). En als laatste redmiddel kan ook de sensor in zijn geheel verwijderd worden. Deze wordt weer direct aangemaakt bij het ontvangen van een nieuw bericht.
SensorwaardenVerwijderen waardes
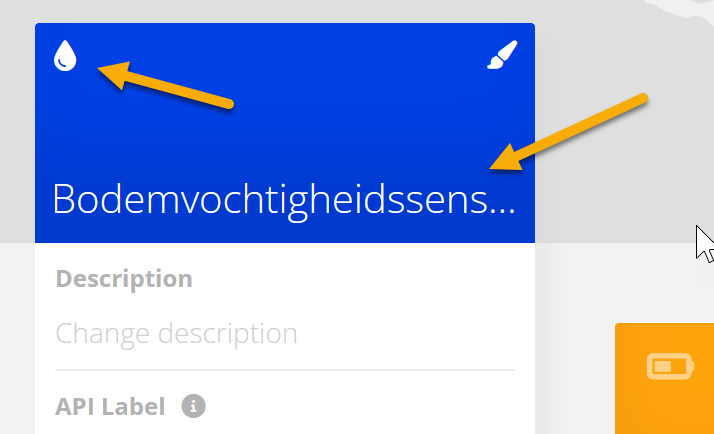
Klik in het blauwe vlak linksboven op de eui-xxx naam. Deze is te veranderen in wat zinvollers (‘Bodemvochtigheidssensor’).
Naamgeving sensor
Klik nu achtereenvolgens battery, humidity, soil en temperature aan.
Sensor eigenschappen
Vul nu volgens onderstaande tabel alle waardes in bij de afzonderlijke sensoren:
Opslaan gaat automatisch na het verlaten van het veld.
De naam van de sensor is te veranderen door op het gekleurde vlak te klikken, de naam in te voeren en daarna op ENTER te drukken.
In het gekleurde vlak linksboven is ook te kiezen voor een symbool naar keuze.
Voor het graden symbool bij temperatuur kun je de code ALT-0176 gebruiken (ALT toets ingedrukt houden, en dan 0176 typen op het numerieke keypad).
Sensorwaarde
Naam
From
To
Unit
battery
Batterijstatus
0
3.2
V
humidity
Luchtvochtigheid
0
100
%
soil
Bodemvochtigheid
0
100
%
temperature
Temperatuur
-15
35
C
Sensoren
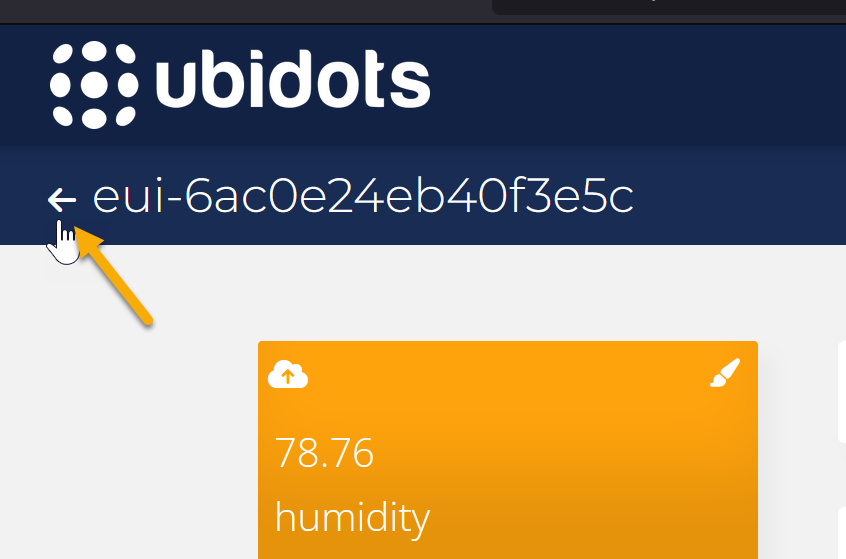
Om terug te keren naar het overzichtsscherm, klik linksboven op het pijltje links van de sensornaam.
terug naar overzicht
Alle variabelen zijn nu gedefinieerd.
Dashboard
Om precies die waardes weer te geven in de vorm die we graag willen is een dashboard nodig. Een dashboard is een samenstelling van een aantal meetwaarden, gevisualiseerd in bijvoorbeeld een grafiek, aanwijzer of thermometer.
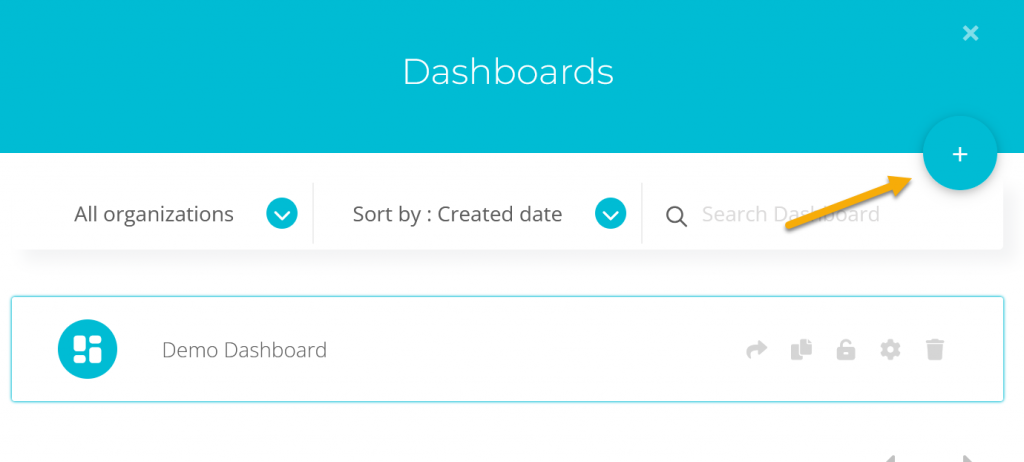
Stap 1: maak een nieuw dashboard aan. Ga naar het hoofdmenu ‘Data’, ‘Dashboards’ en klik op het plus teken.
Data hoofdmenu
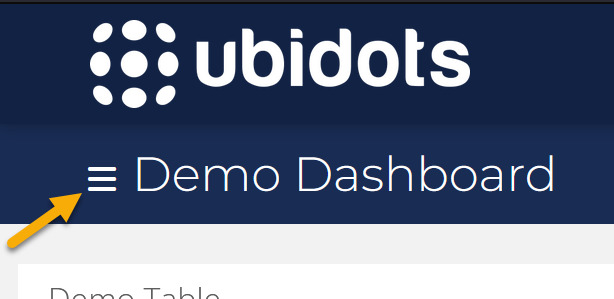
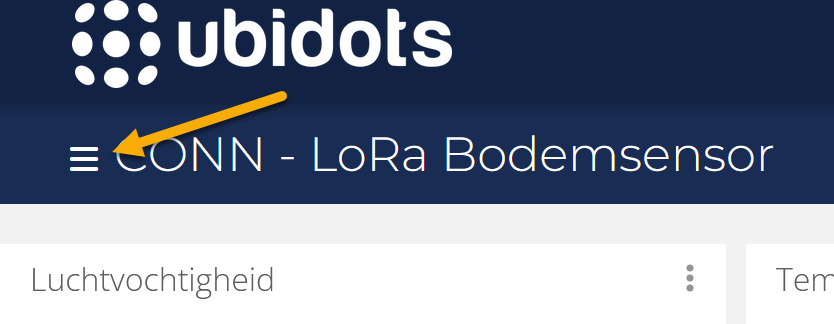
Klik nu op het hamburger menu om in het beheerscherm van de dashboards te komen.
Dashboard menuToevoegen dashboard
In het volgende scherm wordt de naam van het dashboard bepaald, en zijn wat andere instellingen te doen, zoals datumformaat (NL zoals hier getoond).
Dashboard instellingen
Vullen dashboard
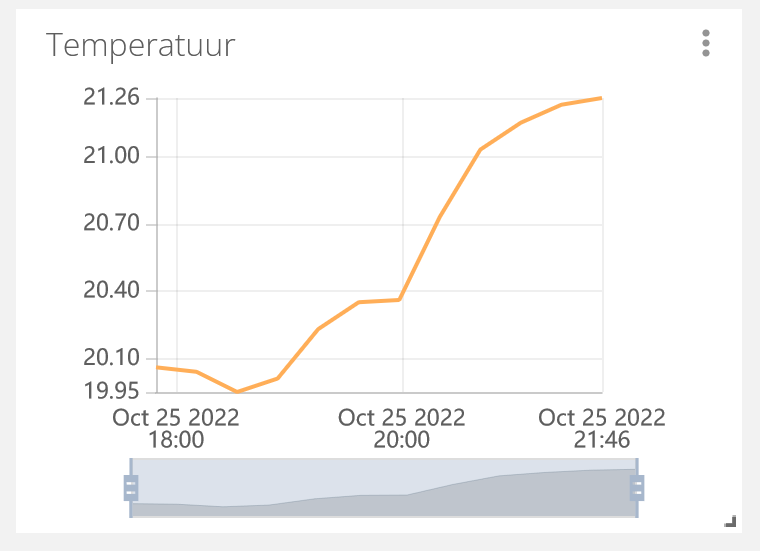
De mogelijkheden zijn legio. Voor de hand ligt de thermometer voor de temperatuur:
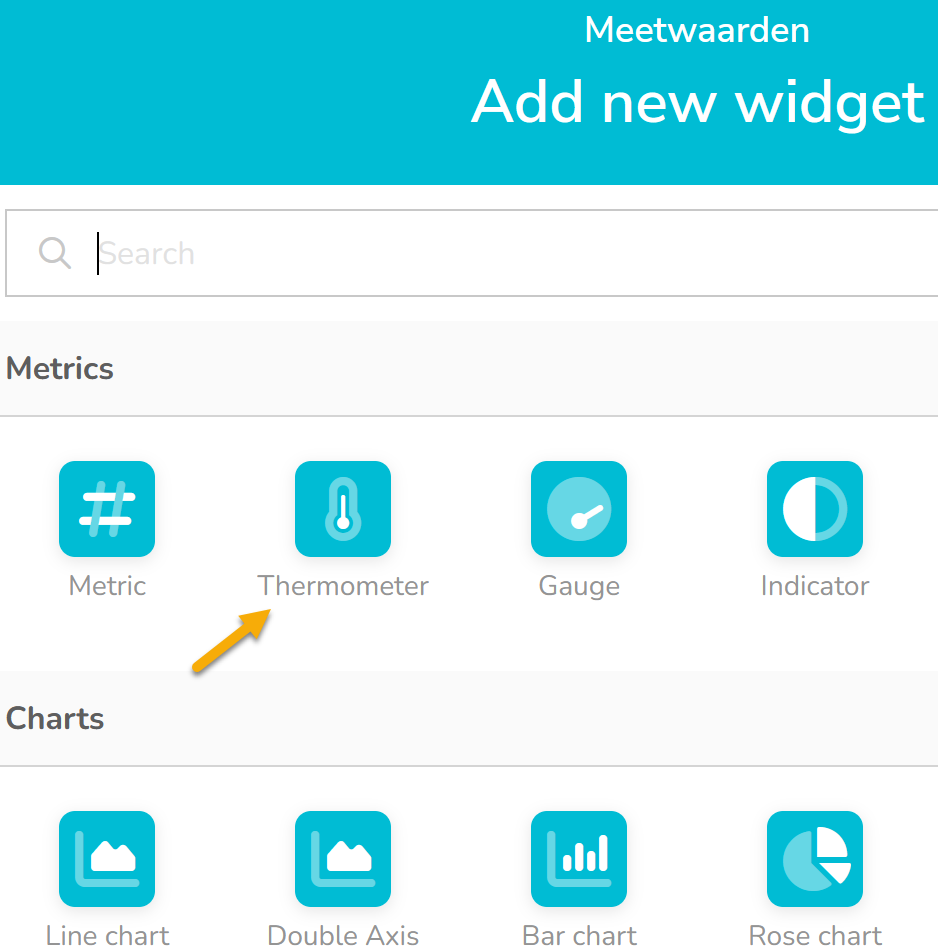
Klik op het plus teken aan de rechterkant
Kies in het widget scherm voor ‘Thermometer’
Add Thermometer widget
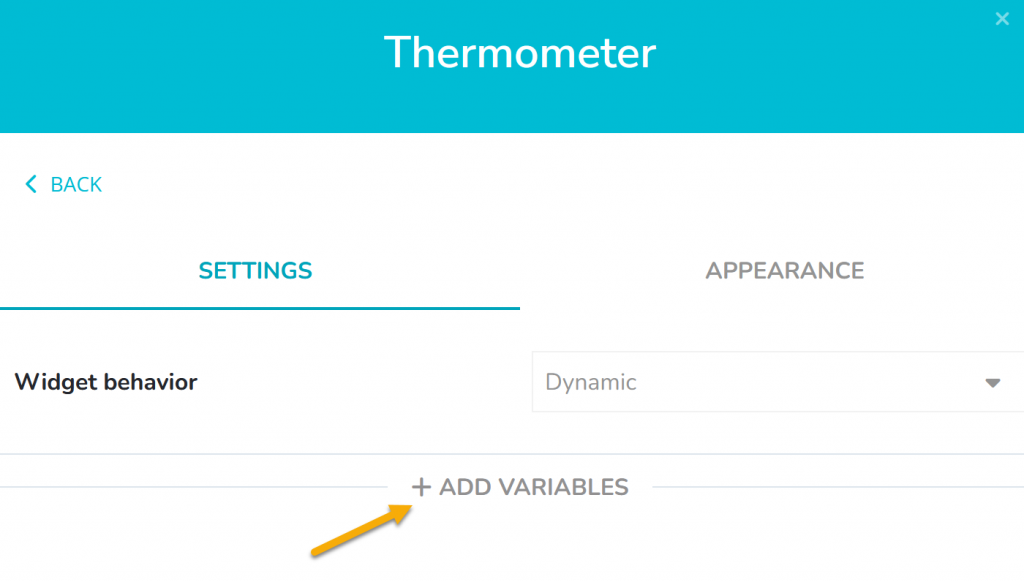
Kies voor ‘+ Add variables’
Add variables
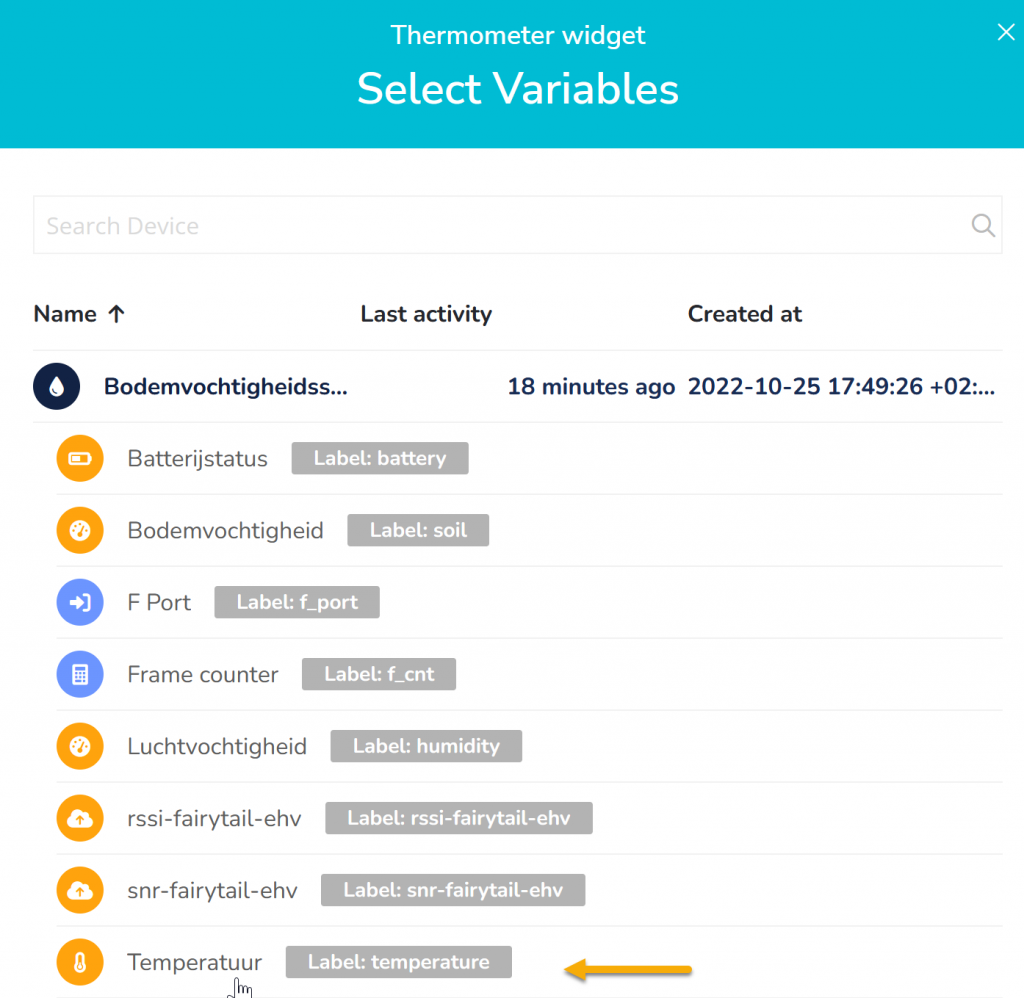
En daarna de juiste sensor en sensorwaarde.
Selectie variable
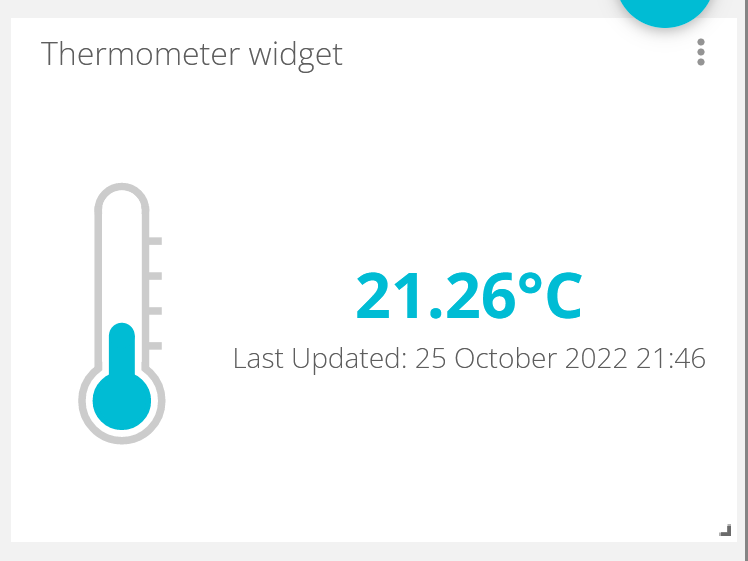
Met ‘Select’ wordt de variabele toegevoegd, en daarna met ‘Save’ opgeslagen. Op het dashboard komt nu de thermometer met de laatst gemeten temperatuur.
Thermometer widget
Bij de eigenschappen (aan te passen via het menu met de drie punten) is via Apperance bijvoorbeeld de Titel, bereik (laagste en hoogst getoonde waarde) en de kleurstelling van de widget aan te passen.
Op dezelfde manier zijn andere widgets aan het dashboard toe te voegen, naar wens groter of kleiner te maken of te verplaatsten. De Line Chart geeft bijvoorbeeld het verloop van een meetwaarde in de tijd aan.
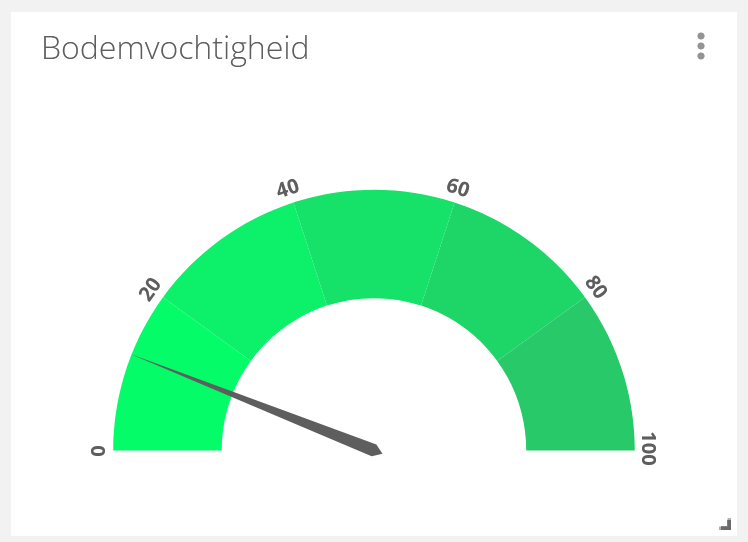
Line chartGauge wdiget
Om een wijzer te maken van 0 tot 100 zijn de volgende stappen nodig:
Voeg de ‘gauge widget’ toe aan het dashboard
Kies met ‘Select variables’ de juiste sensor (device) en waarde (bv soil voor bodemvochtigheid)
Met ‘Save’ wordt de widget opgeslagen en getoond op het dashboard.
In het ‘Appearance menu’ kun je aanpassingen maken voor wat betreft kleur, lettertype etc.
De widget is altijd aan te passen met de drie puntjes rechtsboven
Toegang tot het dashboard
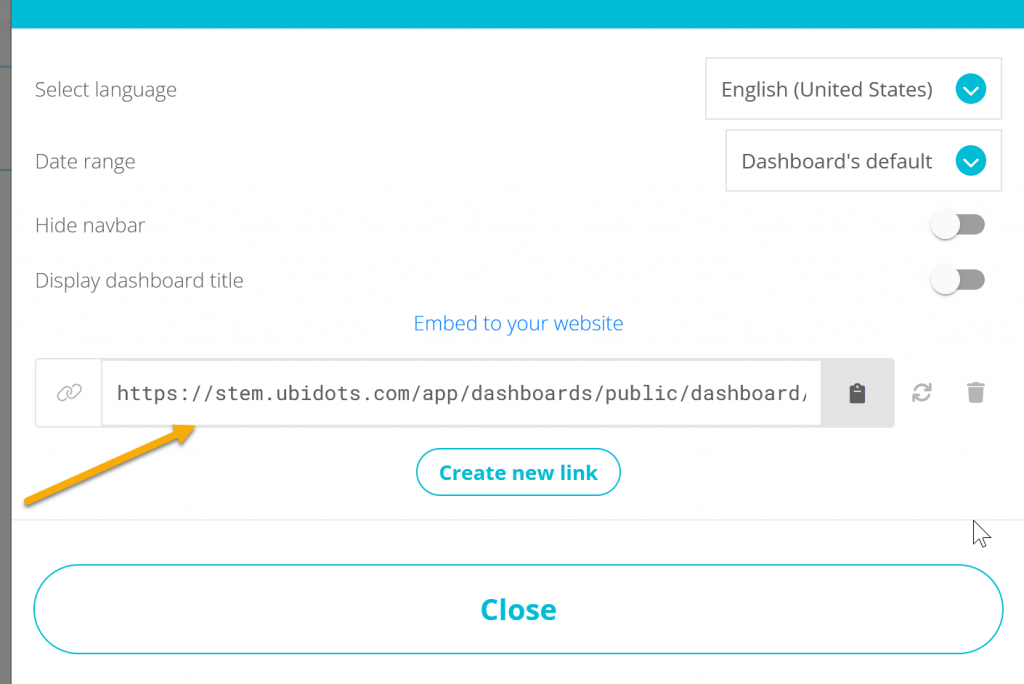
Om zonder in te loggen het dashboard te tonen is het mogelijk om een publieke link te maken. Ga hiervoor als het dashboard getoond wordt naar het ‘hamburger’ menu linksboven.
Dashboard menu
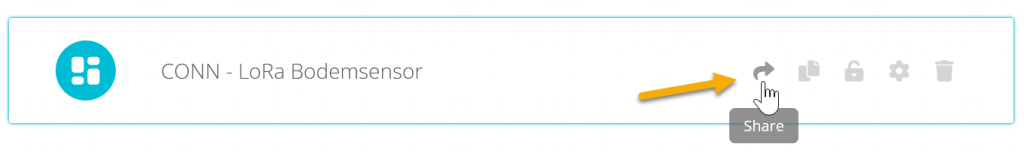
Ga naar het pijltje voor ‘share’:
Share Dashboard
Kopieer dan de link die getoond wordt en mail hem naar jezelf, of diegene die het dashboard mag inzien. Met deze link is ook zonder account toegang tot het dashboard te verkrijgen (maar het is dan natuurlijk niet aan te passen):
Link naar dashboard
Events
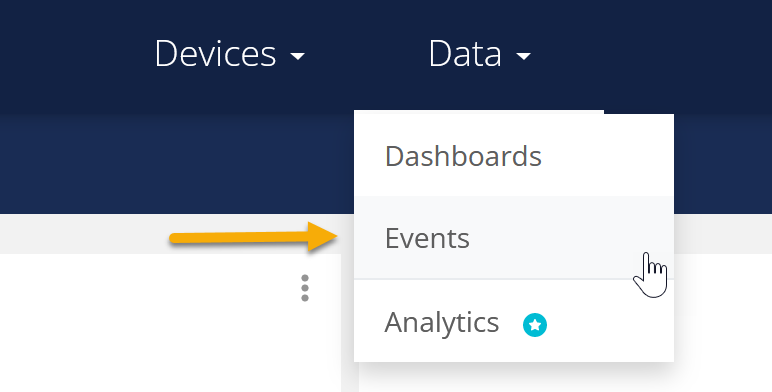
Naast het tonen van de meetwaarden biedt Ubidots ook de mogelijkheid om actief te informeren bij bepaalde condities. Bijvoorbeeld bij te lage temperatuur, of een plant die droog staat. Kies daarvoor in het datamenu voor ‘Events’:
Events
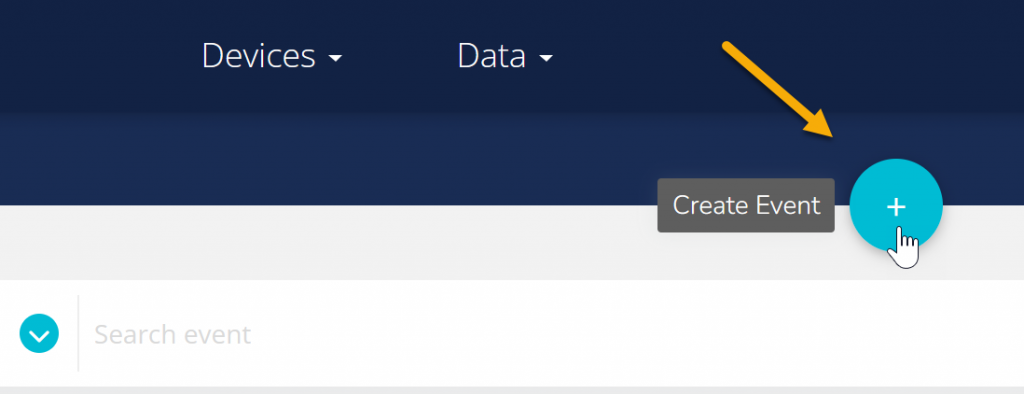
Met het plusteken kun je een event toevoegen:
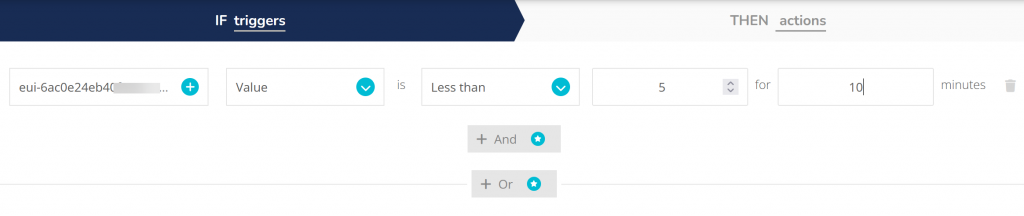
Dit event wordt opgebouwd met triggers die ook te combineren zijn (bijvoorbeeld lage bodemvochtigheid EN hoge temperatuur). Kies bij ieder veld de gewenste waarde:
Trigger
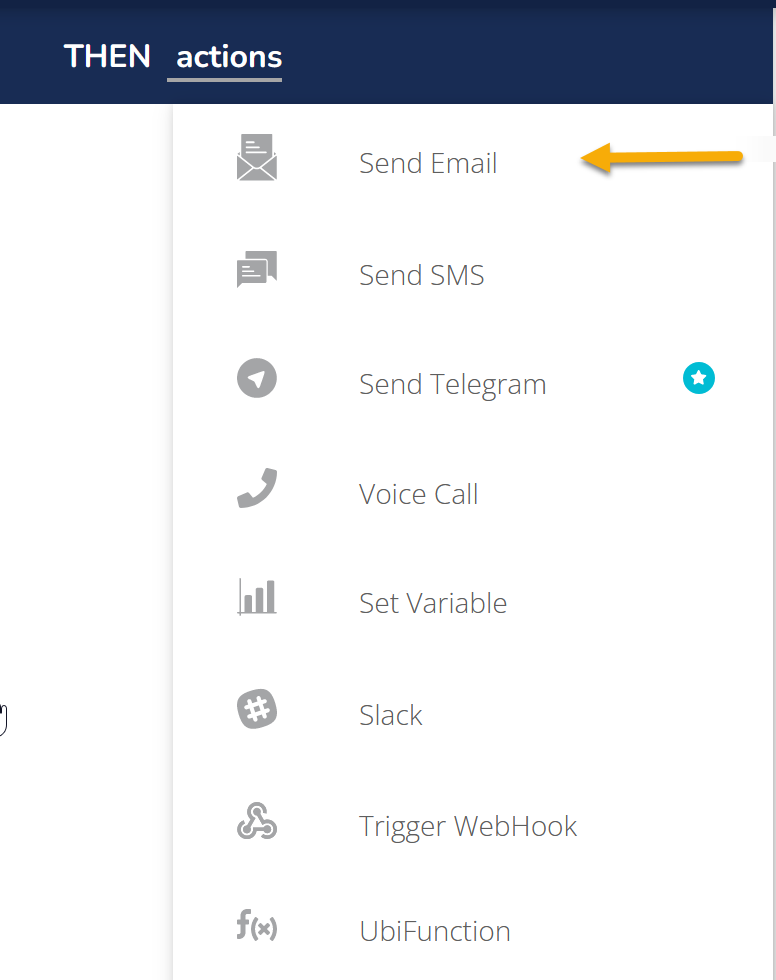
Met het pijltje rechtsonder schakel je naar het ‘actions’ scherm, waar de acties kunnen worden toegevoegd als de gekozen triggers optreden. Met het plusje of ‘add new action’ voeg je een actie toe:
Actions
Verschillende acties zijn mogelijk, bijvoorbeeld het versturen van een e-mail:
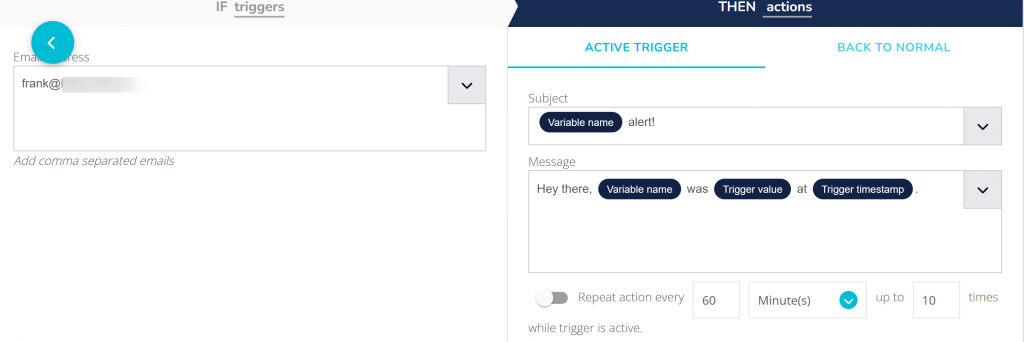
Email action
Vul een mailadres in, en pas zonodig de tekst van het bericht aan. In het bericht kunnen waardes van de sensor meegenomen worden:
Mail action
Bevestig met het vinkje rechtsonder
De optie om een SMS bericht te sturen of te bellen werkt alleen met betaalde varianten van Ubidots.
Frequentie van uitzenden.
De sensor zendt ongeveer iedere 20 minuten een nieuwe waarde. Deze frequentie bepaalt hoofdzakelijk het batterijgebruik. Door de interval groter te maken, gaat de sensor dus langer mee. Je kunt dit aanpassen door de intervalwaarde naar de sensor te zenden:
Het ondersteunde bereik is 05-FF (Hexadecimaal), dus 5-255 decimaal, van 5 minuten tot 4 uur en 15 minuten.
Na resetten van de sensor (of verwisselen van de batterijen) neemt deze weer de standaard waarde aan (20 minuten), om de waarde definitief te wijzigen dient deze opnieuw geprogrammeerd te worden.
Het versturen van de waarde wordt opgepakt als de sensor een waarde heeft uitgezonden. Mocht de sensor ‘slapen’ dan wordt gewacht totdat de sensor weer een waarde uitzendt.
Met een Hex Calculator kun je waardes omzetten van decimaal naar Hexadecimaal (10 -> 16, 20-> 32, 3C-> 60, 40-> 64, 80-> 128, FF->255 etc).
LoRaWAN heeft een ‘fair use policy’. Het is niet toegestaan een frequentieband bovengemiddeld te belasten, en bijvoorbeeld een sensor iedere minuut een lang bericht te laten sturen. Hier wordt niet actief op toegezien, maar The Things Network kan wel sensoren afsluiten als deze over een langere periode te veel berichten ontvangen.
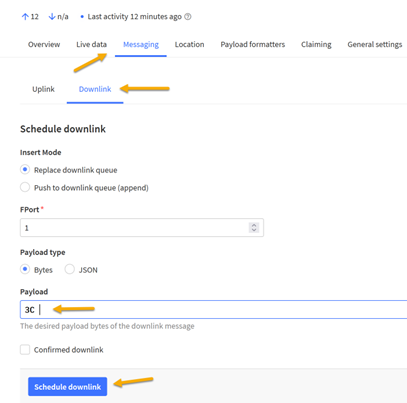
Kies het device, messaging, downlink, vul de gewenste Hexadecimale waarde in (3C voor 60 minuten) en kies voor ‘Schedule downlink’
Downlink sensor
En verder…
De sensor is gecoat met een beschermende lak die er voor zorgt dat hij minder snel corrodeert. Het meegeleverde kastje beschermt de elektronica, maar niet tegen (regen)water. Buiten zal de sensor dus afgeschermd geplaatst moeten worden, bijvoorbeeld onder een bloempot.
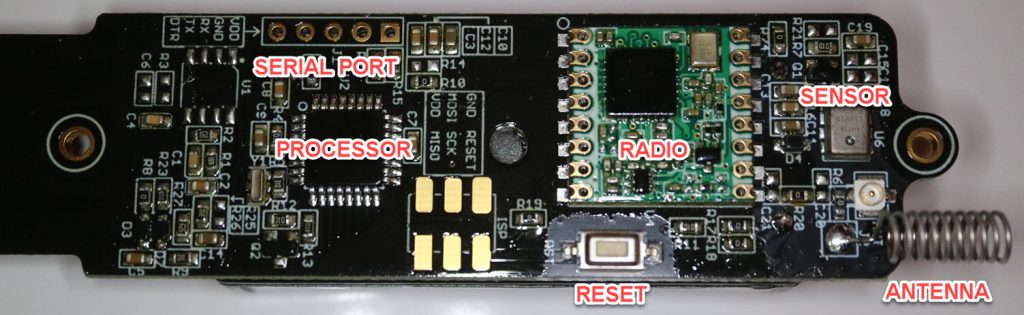
Het is mogelijk om de sensor zelf te programmeren of de logging uit te lezen. Sluit hiervoor een seriële adapter (Bijvoorbeeld deze) aan op de seriële poort. De aansluiten staan gemarkeerd op de printplaat. GND->GND, DTR->DTR 3.3V->VCC, TX->RX en RX->TX. De adapter moet geschikt zijn voor 3,3V en mocht deze ook de voeding leveren dan moet deze op 3,3V ingesteld staan.
Controlling an AXA Remote Window controller from your Home Assistant system
ESPAXA
This module will connect the AXA Remote 2.0 with your Home Assistant Server using ESPHOME. The module will integrate in Home Assistant, showing the position of your Window (open or closed), and give you the possibility to open and close the window from there. The remote control will still work, the status of the window will synchronize with home assistant.
Power
The module is using a 5V power supply, and I use a DC-DC step-up converter (MT3608) to create the 8V (7.5 with some cable loss) for the AXA Remote from the 5V power supply. So, NO batteries needed in your AXA Remote (Remove these before plugging in the connector)! The Power Supply should have enough capacity to handle the motors inside the AXA. Preferable is a Raspberry Pi supply (model 3, 2.5A or more). The power can be connected via the WEMOS USB plug, or directly to the 5V and GND pin of the WEMOS. The DC-DC Converter should be adjusted to 8V, using a multimeter. You can plug in the power adapter to this module as well for delivering power.
Schema
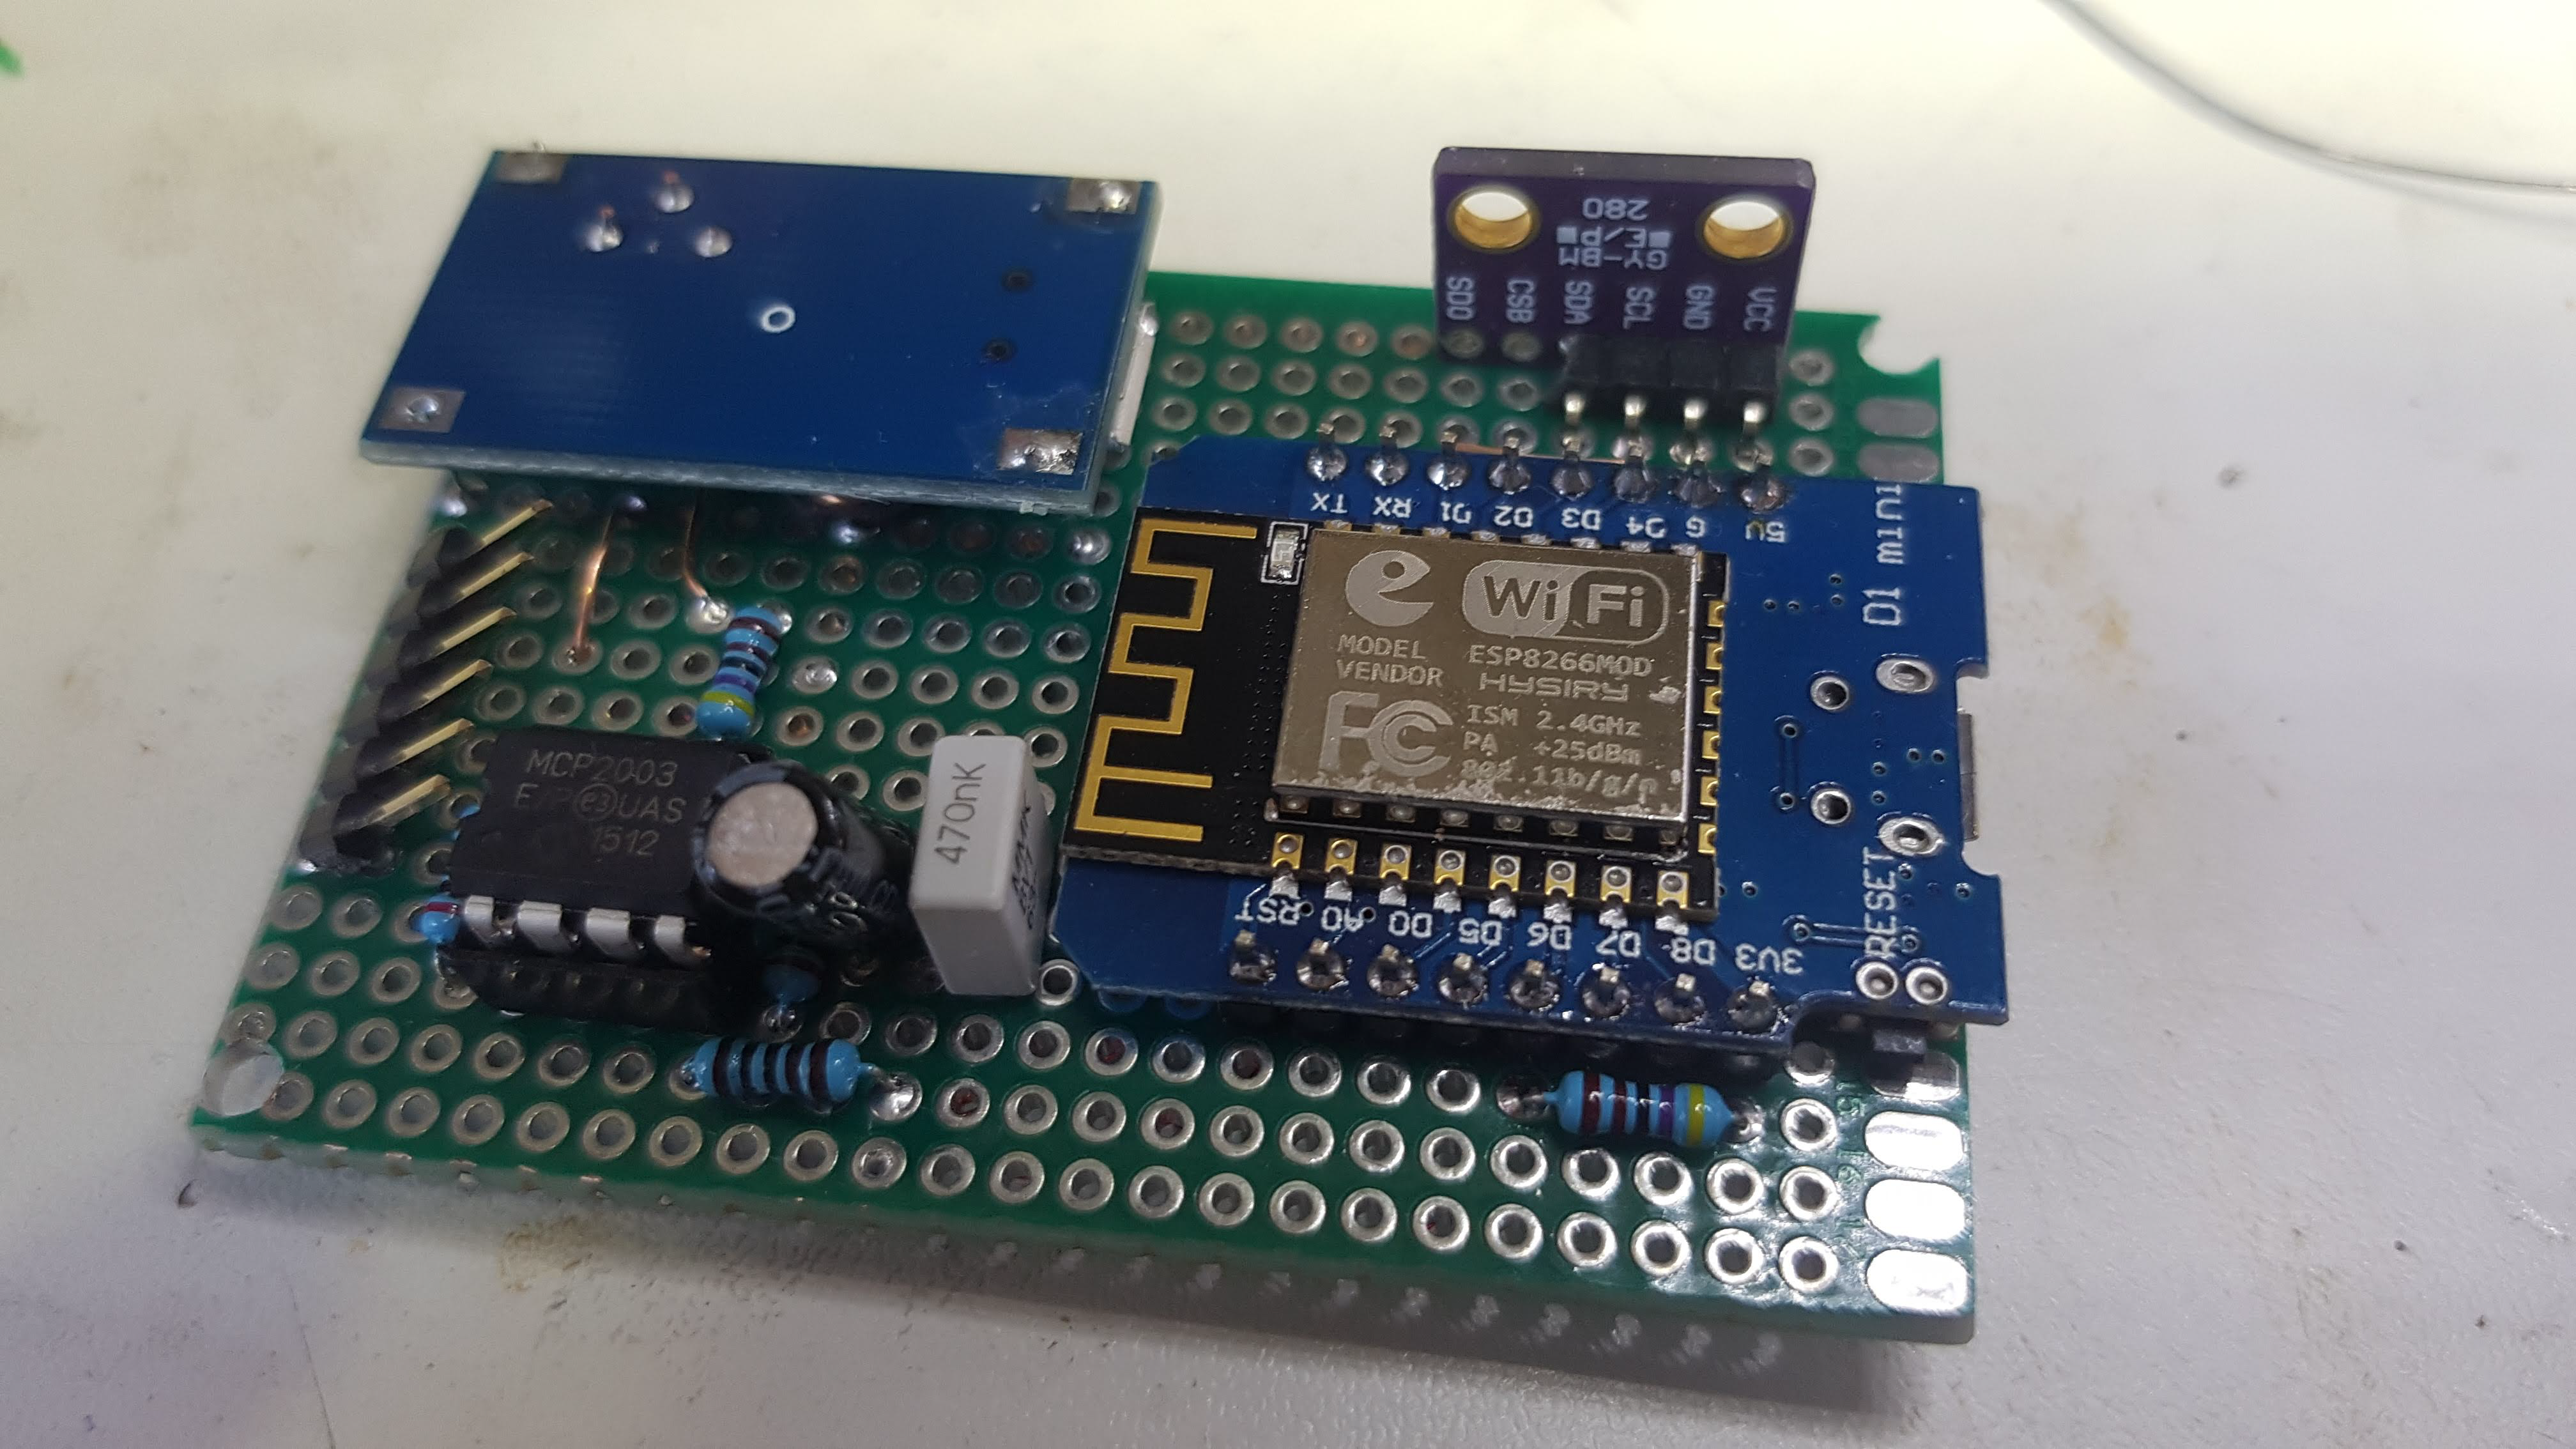
This is more like 'connecting the modules'. The DC-DC converter is connected to 5V and the power input of the AXA Remote (pins 1 and 2). The MCP2003 is the LINBUS driver. It has some special 'low power' capabilities we will not use. Therefor the /WAKE function is disabled, and Vren is not used. RxD is the OUTPUT signal! It should be connected to Rx of the Wemos. This is an 'open drain' output, so we have to pull-up to 3.3V to create a Wemos compatible signal. The input is Tx, this is a TTL compatible input, but will accept the 3.3V as a '1'. The decoupling capacitors used are 47uF, but any value > 10uF is OK. As an extra a BMP/BME280 module is integrated to measure Temperature, Pressure and Humidity (BME). A nice feature of ESPHOME, just to show, but not necessary for the AXA control.
Components
Sometimes difficult to find, my sources (NO affiliate links 🙂 ):
No PCB (yet), so you must use a protoboard to connect the components. Before connecting the AXA and the MCP (if you use a socket), measure the correct voltage on the MCP2003 pins (8V) and the AXA connector. Be aware that mounting the temperature sensor as shown, will give a +5 degrees temperature due to the 'hot' Wemos module. Attach the sensor with wires, if possible.
Programming
We use ESPHOME to create the firmware. This is more like a configuration than a program. espaxa.yaml has all the definitions and is also referring to some program code in AXA/espaxa.h. You must create this directory and put the expaxa.h file in it. Also fill in the WiFi credentials (or better: use the secrets file). More info on esphome
here or here. To start, connect the ESPAXA (without connecting the AXA Remote) directly to your USB port to upload the sketch the first time. Now OTA is installed, you can upload any new sketch 'Over the Air'. ESPHOME will try to find the module itself. If not, you must manage your DHCP server and 'hardcode' an IP address. The 'Closing' sequence starts with a short 'Open' command. It seems the AXA Remote will 'block' at the end position. By sending an 'Open' command before closing, the unit will 'deblock'.
Connecting
Use a RJ12 connecter to connect the module to the AXA remote. Use the connection in the schema. Remove the batteries in the AXA Remote!
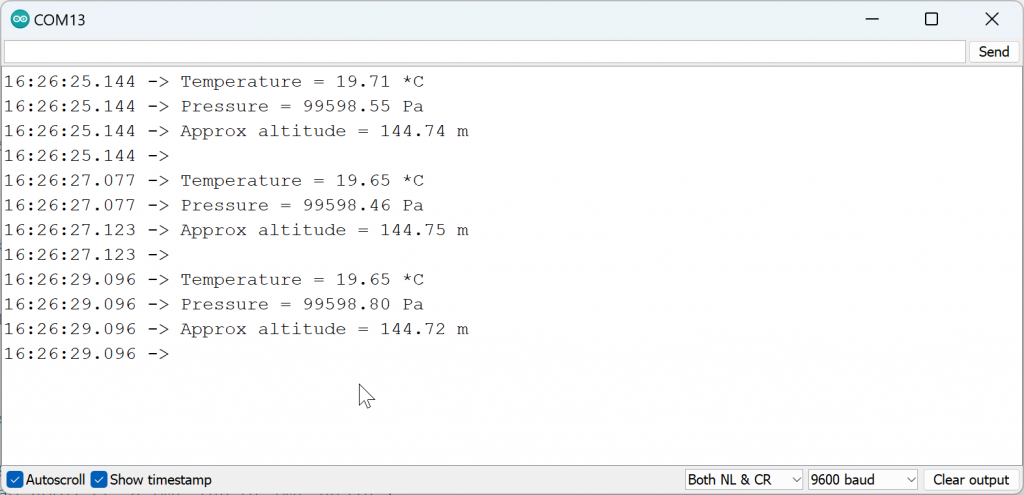
Logs
By looking at the logs (you can use the webserver at the modules address, the serial port output or the esphome logs command), you can see if the module is working. It will output the WiFi connection, Home Assistant connection and at a 30 sec interval the state of your Window. If any command is given, this will show up as well.
[20:44:04][D][sensor:092]: 'Axa Window': Sending state 0.00000 with 0 decimals of accuracy
[20:44:34][D][espaxa:054]: 211, 211 Strong Locked
[20:44:34][D][sensor:092]: 'Axa Window': Sending state 0.00000 with 0 decimals of accuracy
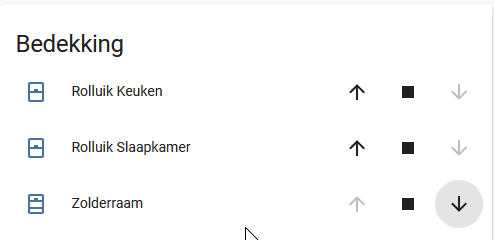
[20:44:59][D][cover:072]: 'Zolderraam' - Setting
[20:44:59][D][cover:082]: Command: OPEN
[20:44:59][D][cover:152]: 'Zolderraam' - Publishing:
[20:44:59][D][cover:160]: State: CLOSED
[20:44:59][D][cover:168]: Current Operation: IDLE
[20:45:04][D][espaxa:054]: 210, 210 UnLocked
Home Assistant
The ESP module will show up as a new integration. After enabling this integration, you can add the entities given in your espaxa yaml file in your interface. The objects will already use their default MDI picture.
Use this project as-is, I am not responsible for any unexpected open window at your home, or any damage to any hardware. This is a creative commons project, for non-commercial use only.
todo
PCB?
multiple AXA Remotes chained? Two should work on one power supply, more will need some adjustment in the power management.
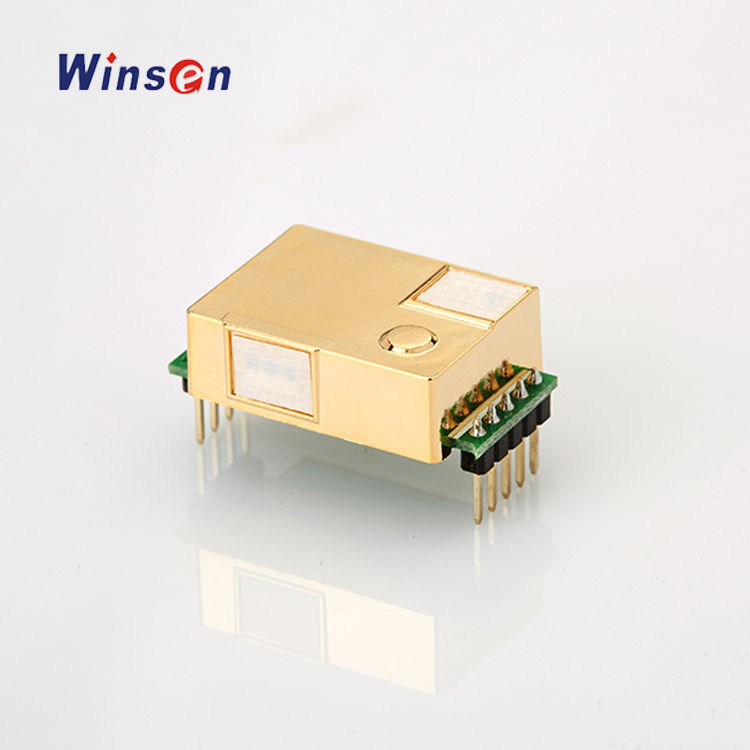
Following the ESPHome introduction, we use the Winsen CO2 sensor to measure indoor CO2 level. For reference look at the datasheet.
The sensor outputs the measured CO2 level in a PWM signal and a UART (serial) stream. We will use the UART interface in our example.
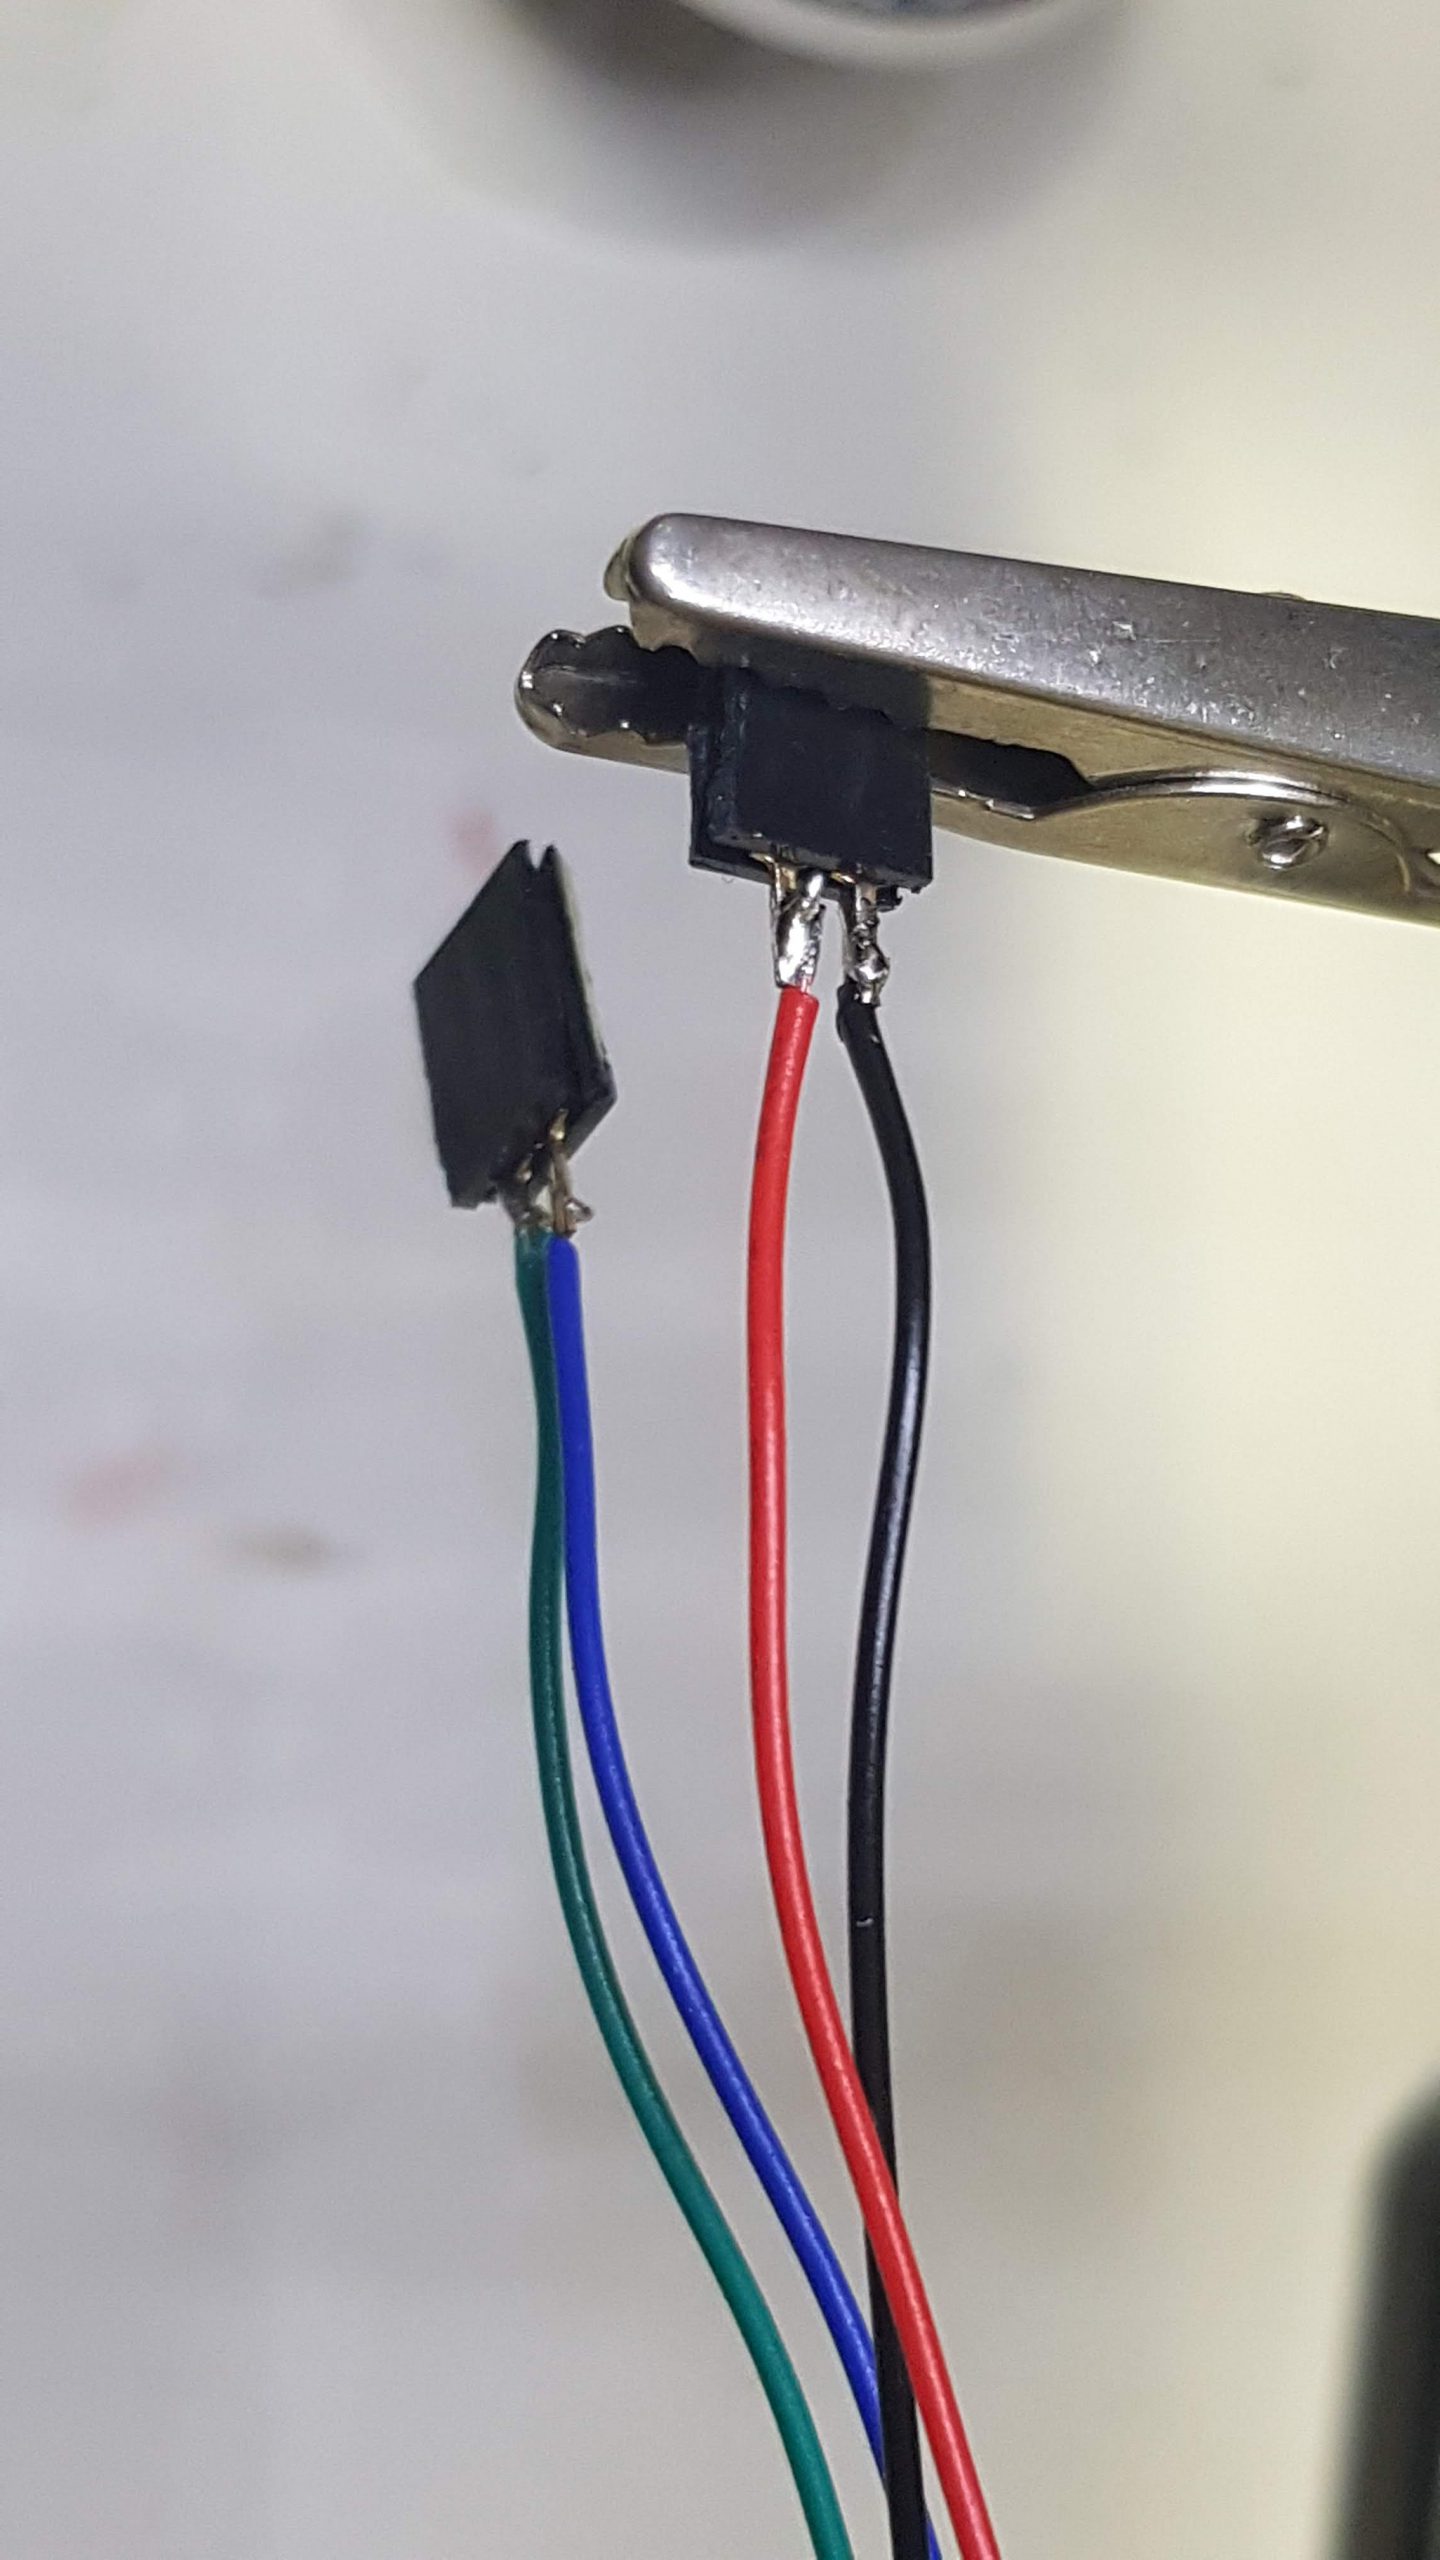
Connection
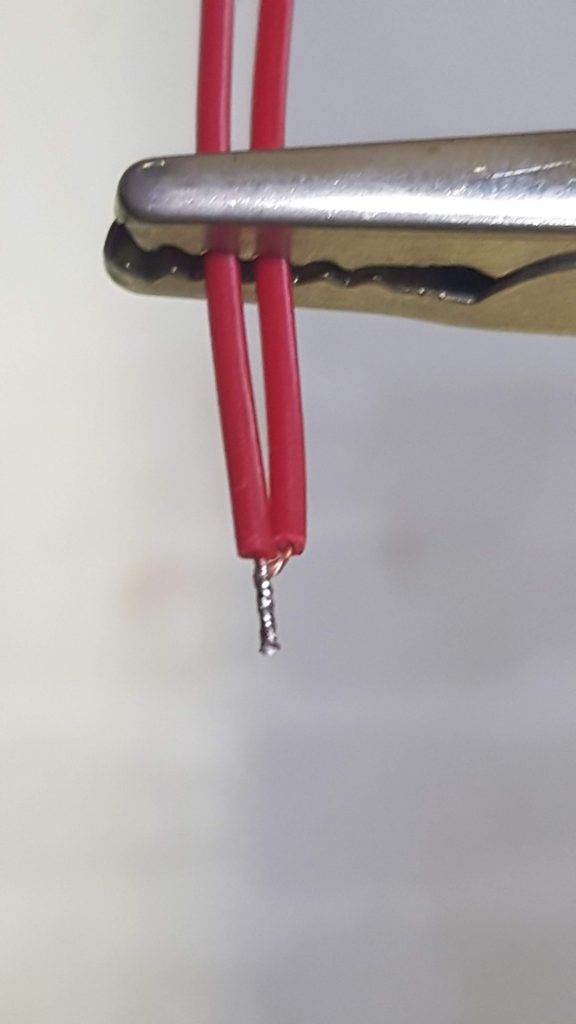
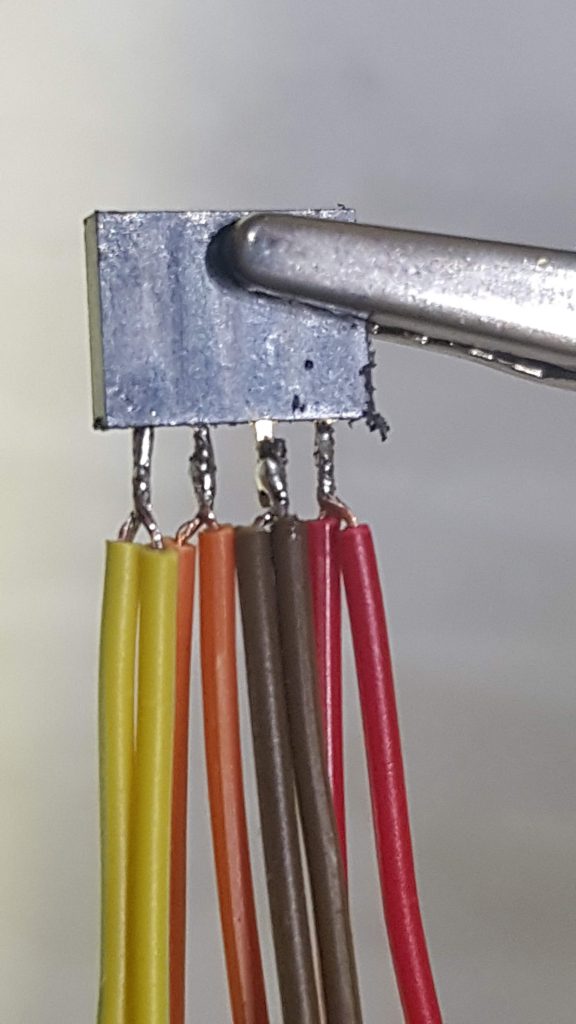
We need four connections: power (5V – 150mA, GND, Rx and Tx). If you use the sensor with the JST6 cable you can solder plugs on these wires, or use Dupont crimp connectors. In the case you solder them you can connect Red / Black (Power) to one 2 pin female header, and Blue/Green (Rx/Tx) to another 2 pin header as shown.
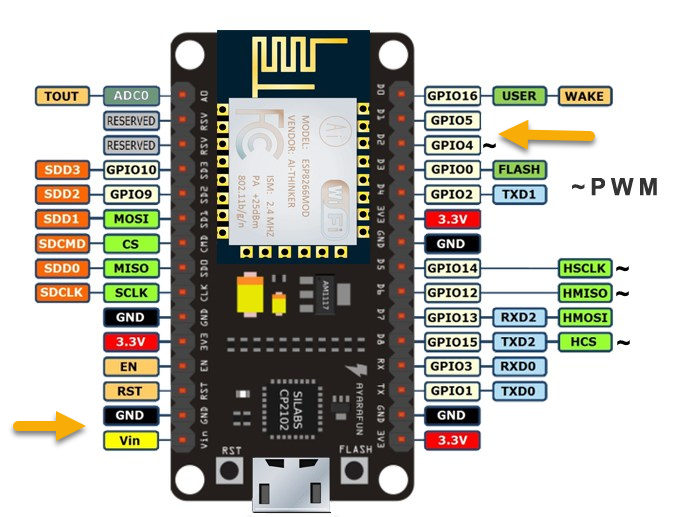
Both on Wemos D1 and NodeMCU v2 the 5V power line (or Vin) is besides Ground (or ‘G’). Connect the power connector according to the colours (5V is Red, Ground is Black).
The Rx / Tx lines are connected to D1 (GPIO5), Green, Tx from module and D2 (GPIO4), Blue, Rx to module.
YAML file
We will use ESPHome for the software. If you are not familair with ESPHome, have a look at our previous workshop. Now we can add the sensor and the UART to the YAML file. First we will activate the uart. Feel free to use other pins if you use another ESP module.
#D1: Green Wire / mhz19
#D2: Blue Wire / mhz19
uart:
  rx_pin: D1
  tx_pin: D2
  baud_rate: 9600
We will add the MHZ sensor just before the BME280 sensor. There can only be one ‘sensor’ section! The sensor has also a temperature sensor, we will not use it here. More details on the ESPHome site.
If we upload our code, the ESP will initialize the sensor and read the values. They are also available at the webinterface and will be published on the MQTT chanel if you activated this.
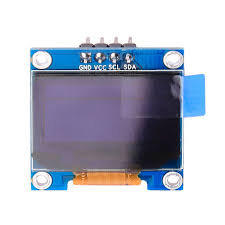
Add a display
To show the values on a small I2C display, we first have to connect the display to the I2C bus. That is a challenge, because the BME280 sensor also shares this bus. On a breadboard it is easy to connect both the Display and the BME280, if you want to solder you have to create a ‘splitter’. This can be done by soldering, or with crimp connectors.
GND should be connected to G or Ground, VCC to the 3V power line (some displays will accept 5v as well). SCL to D6 (GPIO12) and SDA to D7 (GPIO13). I2C was already installed in our previous YAML experiment. We will need a font, which can be downloaded here. You are free to download other fonts and experiment with a nice layout.
To experiment, the complete YAML file can be downloaded here.
Captive Portal
If you do not know the WiFi network at compilation time, you may use a ‘captive portal’. If the given WiFi network was not found, your node will start as an access point with the given credentials. You can connect with your phone or PC, go to 192.168.4.1 and enter the right credentials. They will be stored until the next upload of your program.
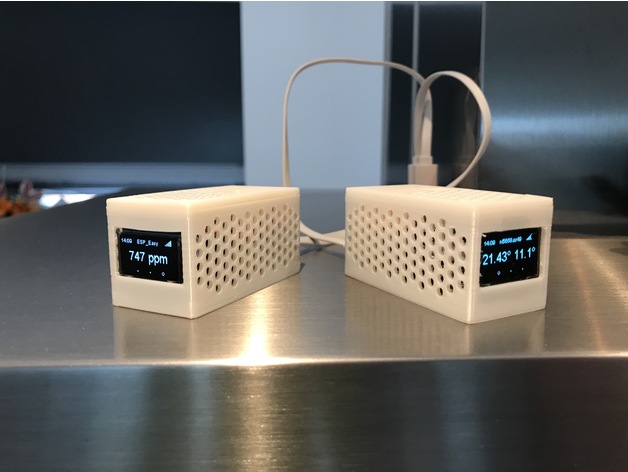
Stefan has created a nice casing for this module. Details can be found here. In the written setup ‘ESPEasy’ is used to connect the sensor. Feel free to use this, or the ESPHome implementation.
We will use ESPHome to create the binaries for the ESP8266 module. ESPHome will create a binary from a ‘YAML’ script file. ESPHome is written in Python and is using ‘PlatformIO’ to build the software. If you installed already some components, you may skip these steps.
Install Python
If you already installed Python, you should check your python version:
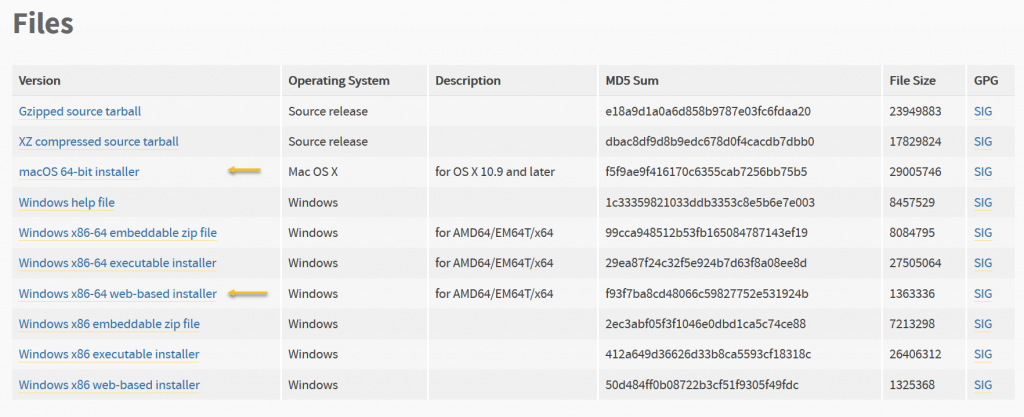
Depending
on your local OS choose Mac or Windows Web installer:
To install
the Windows web-based installer, download the file and start it from the
‘Download’ directory:
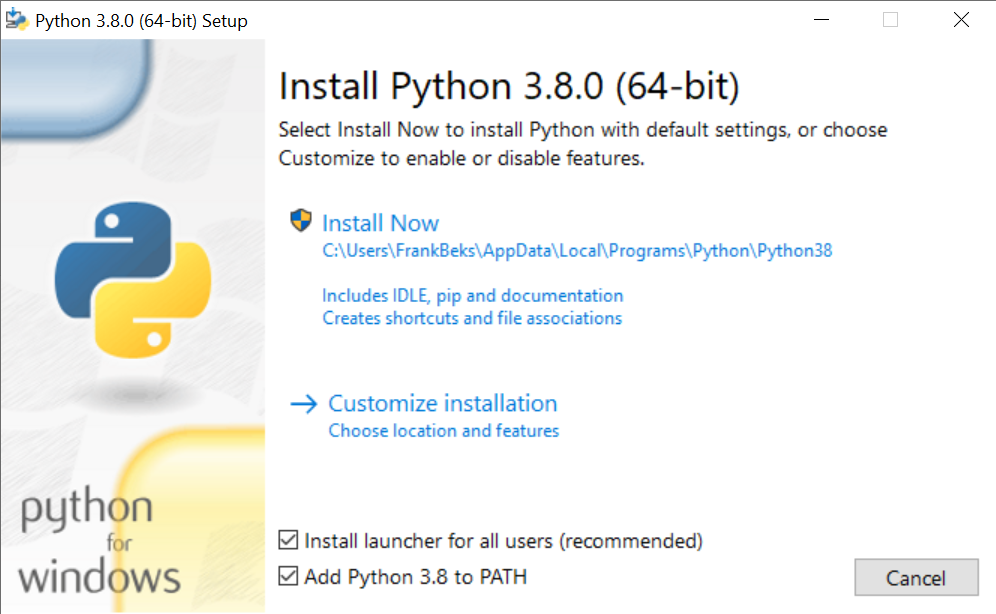
Check the
‘Add Python 3.8 to PATH’ check box and choose ‘Install Now’
Choose ‘Install
Now’.
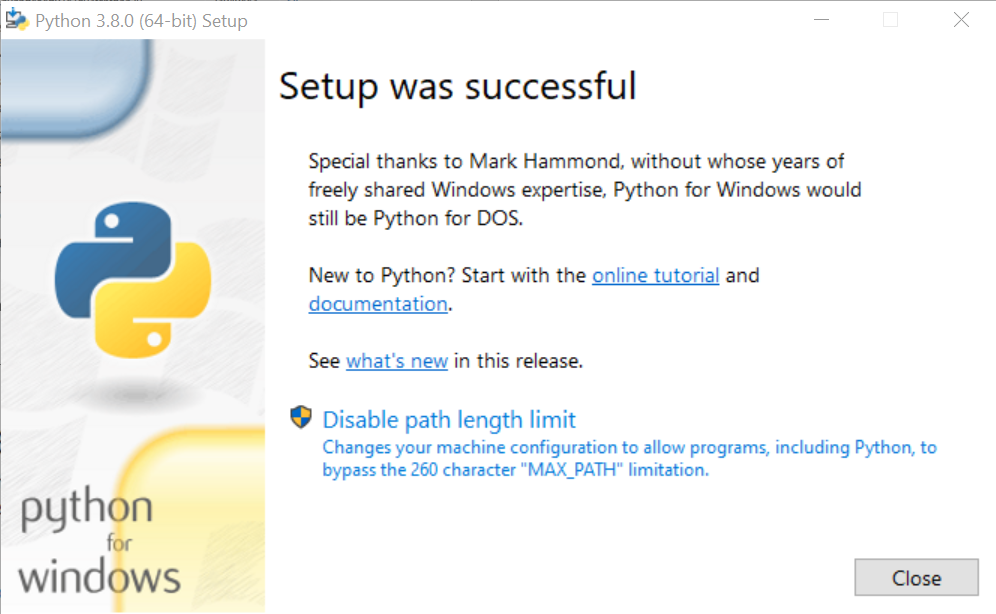
After
installation choose ‘Disable path length limit’ (just in case) and ‘Close’.
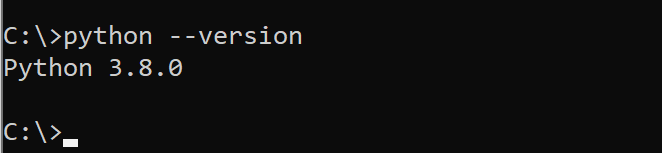
Check your setup by opening a CMD window entering the ‘python –version’ command:
python --version
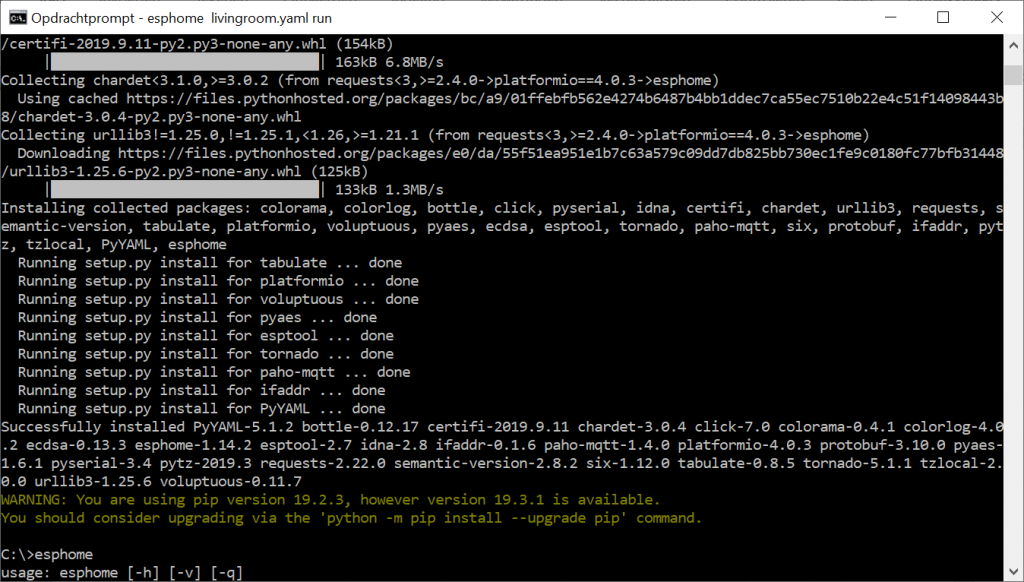
Start the installation of esphome:
pip install esphome
This will
install all the components needed.
Now you can
create your first ‘YAML’ file.
Create a
working directory in your home or documents directory and select this
directory:
CD <documentsdir>
md esphome
cd esphome
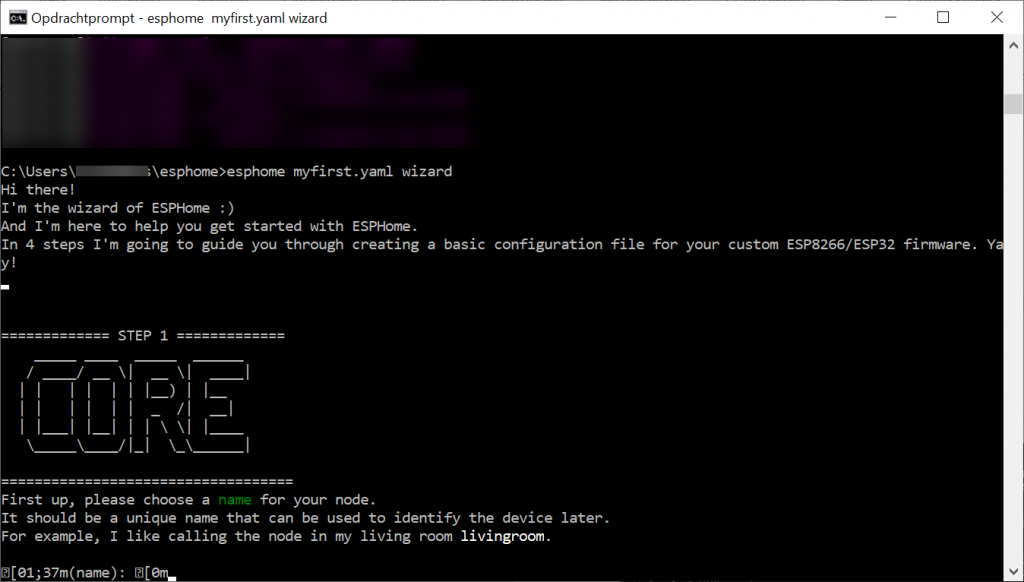
esphome myfirst.yaml wizard
The Wizard
is helpful in creating your first YAML file. First enter a chosen name for your
node. This name will be broadcasted in the WiFi network, so choose a unique
one!
Step 2 is
asking for the platform (ESP32 or ESP8266). Choose, depending on your hardware.
In case of
the workshop you should enter ESP8266, and Nodemcuv2 or d1_mini (WEMOS).
Step 3,
enter your Wifi credentials (SSID and password)
In Step 4
you can enter a password for the OTA setup. In case of an untrusted network
this will give you some more security
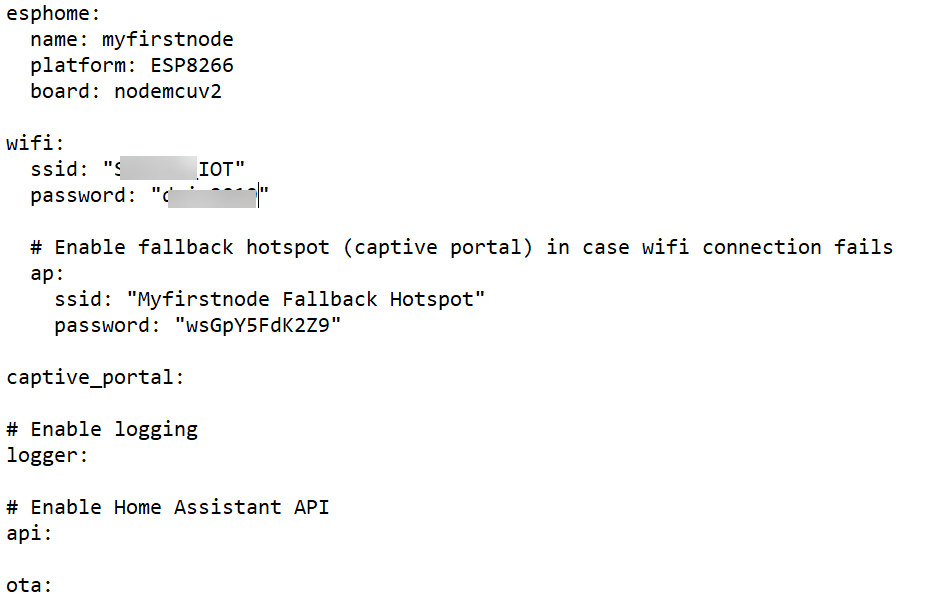
Now your
YAML file will be created, it is an ASCII file which can be edited by your
favourite editor (or notepad):
This file
can be edited here, so any configuration changes can be done from here.
Now the
magic will start. Connect an USB cable to your ESP8266 board and enter:
esphome myfirst.yaml run
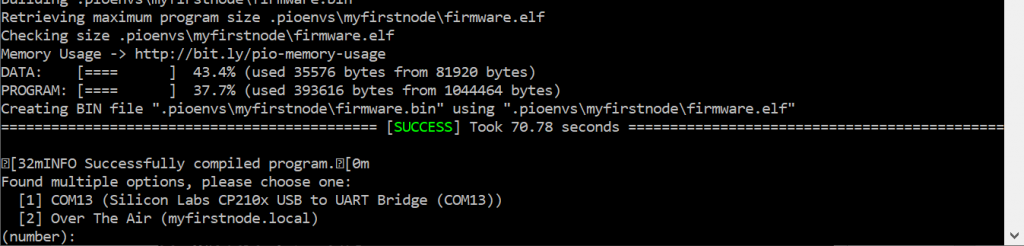
This will
compile your yaml file, create and upload the binary firmware to your module.
Compilation will take some time, because platform and libraries should be
loaded first. After compilation you get the option to upload the file:
Choose the
COM port (you should first upload the code by USB). After uploading the ESP
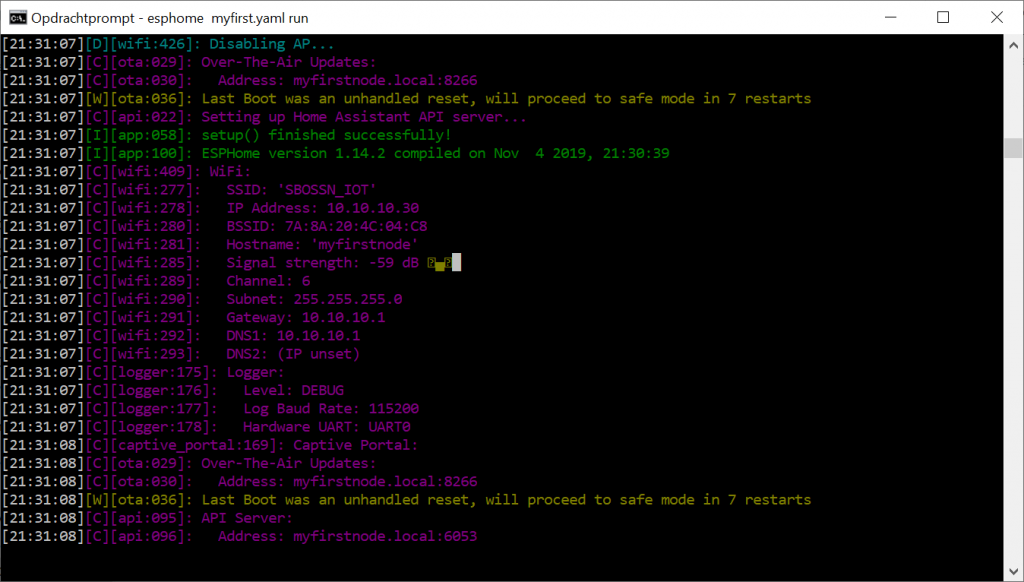
will reboot and try connect to the given SSID. The USB port will now act as a
logging port and esphome will display the messages:
The Blinking Led
The Hello
World example of IoT / The Embedded world. So here we go:
To
configure the options from your ESP module, you have to add some lines to the
YAML file. Open the YAML file with notepad or any other editor. Add the
following lines:
Be aware of
the spacing, you should use two spaces for every intended line! 16 is the GPIO
pin from the build-in LED in the NodeMCU v2 board. You should change if needed
for WEMOS (GPIO pin 2).
Now you can
again upload the code:
esphome myfirst.yaml run
Upload
should be possible now with OTA (over the air programming). Important to check
the uniqueness of your nodename. USB cable is a safe option, but give it a try.
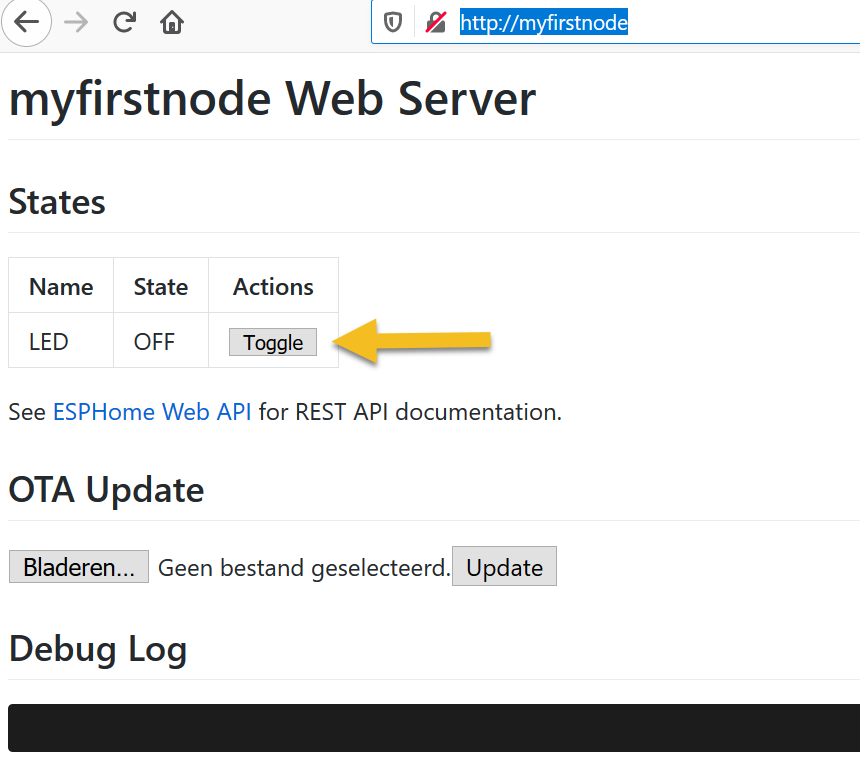
Now try to connect to your node: http://myfirstnode , you should enter here your given name in step 1 of your project, be aware this will only work if everyone in the same network uses a different name.
Now you can
toggle the LED by clicking the ‘Toggle’ button. The debug screen will give more
information.
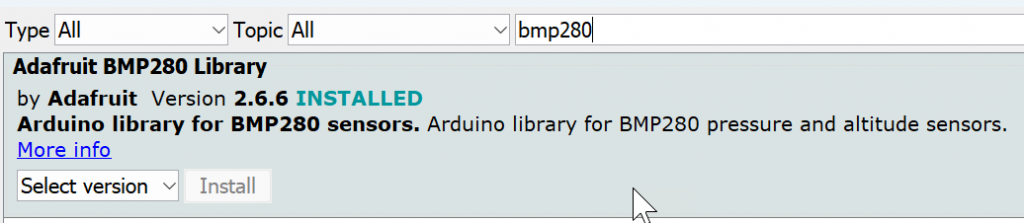
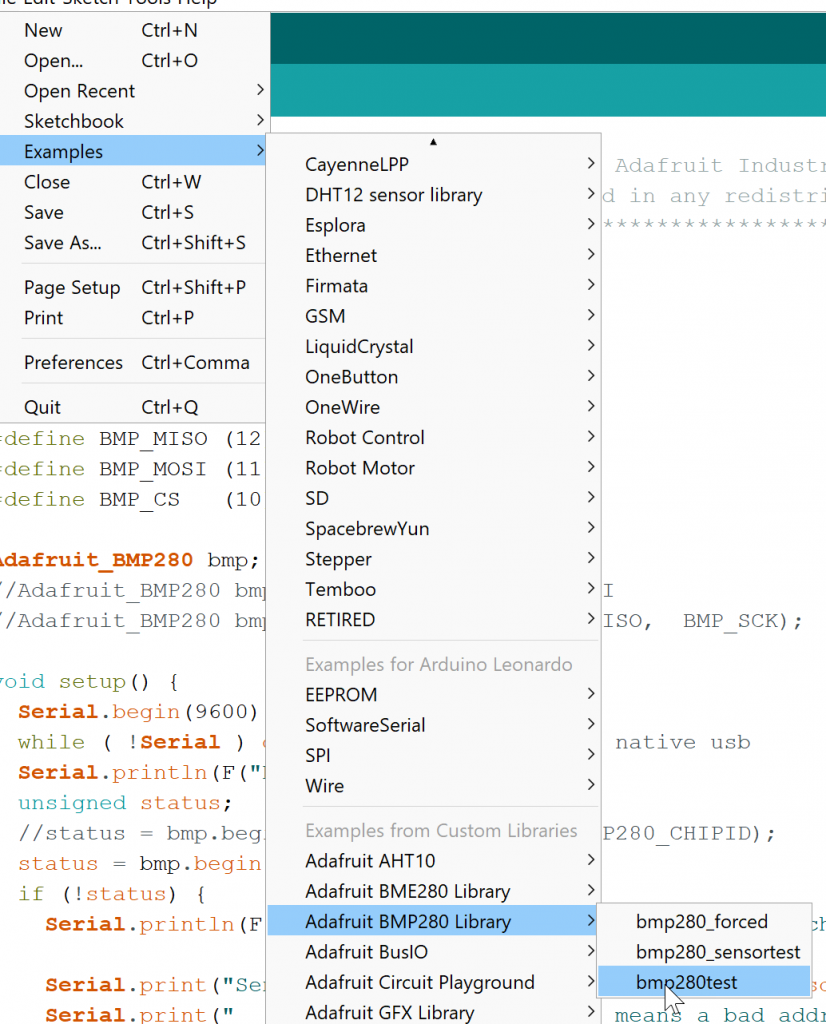
Reading a BMP280 sensor
Check out https://esphome.io/ , you see a lot of integrations
possible. Choose any sensor you like, add it to some spare pins of your ESP
module, add the configuration to the YAML file and here you go!
BMP280
sensor
This sensor
is connected by i2c bus. Connect GND to GND, VCC to 3v3 (BEWARE: the sensor
can’t handle 5V!!), SDA to D2 (Wemos) or GPIO4, SCL to D1 (Wemos) or GPIO5.
First
install i2c in yaml, and then add the sensor:
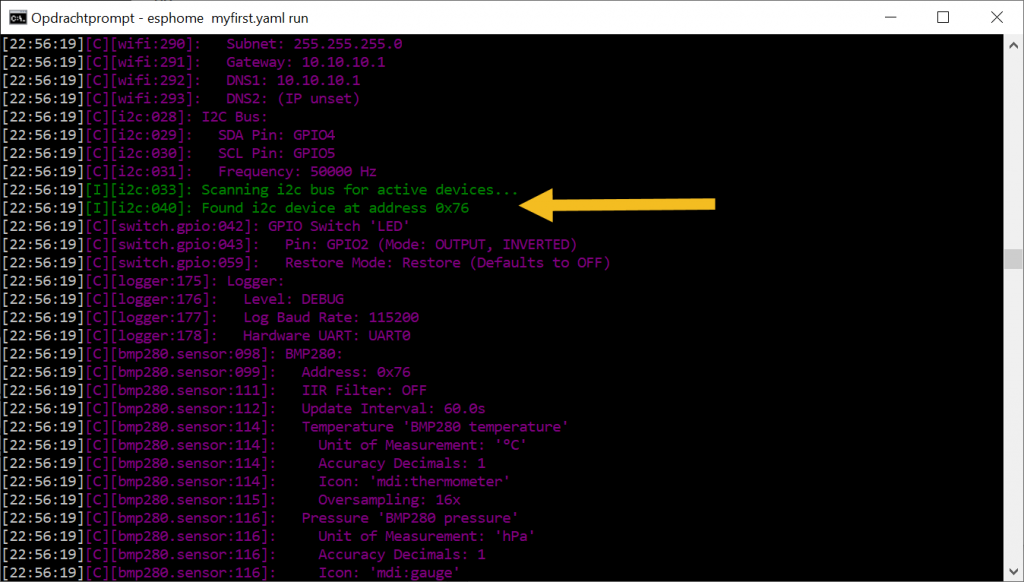
After
uploading the code, the startup logging will show the i2c bus scan (due to
‘scan: true’), check if the sensor is found here:
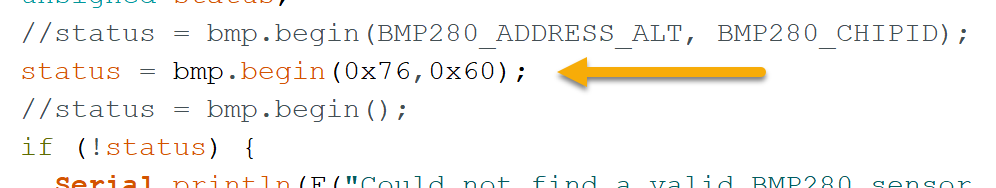
Check if
your sensor shows up here, may be you should change the address (0x76 to 0x77)
depending on your hardware.
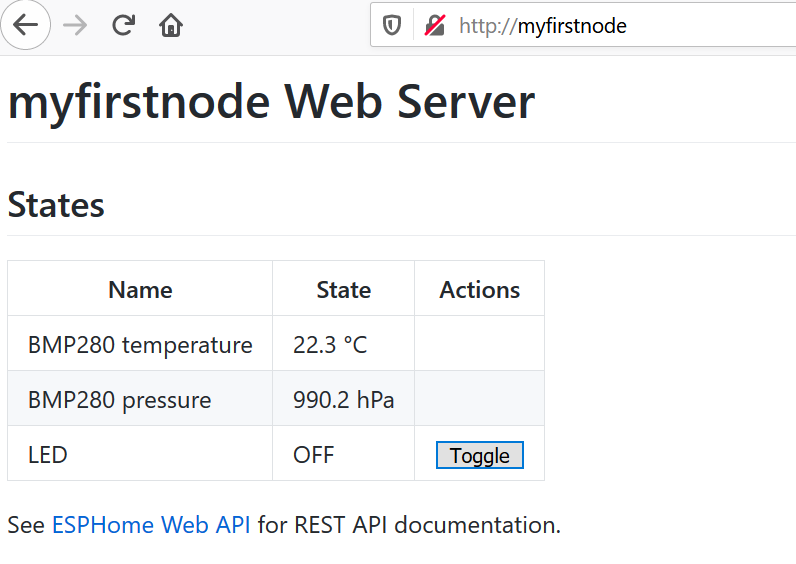
Automagically
the sensor values show up in the webserver:
Publish to MQTT
To publish
your data outside the ‘Home Assistant’ environment, you can use the common MQTT
interface. You may use your own, local, MQTT server like Mosquito on your PI,
or use a public one like ‘HiveMQ’. If you use an external service, be aware
that anyone can read the results. Add the following lines to the YAML file:
mqtt:
  broker: broker.hivemq.com
You should remove
the ‘API’ line, or add a # (‘comment’):
# Enable Home Assistant API
#api:
After
uploading, all the results from sensors, state of switches and even debugging
messages are published to the MQTT server. The syntax is straight forward:
<name of your esp, as used in ‘step 1’>/sensor/bmp280_temperature/state is the topic used for the BMP temperature. You could change your ESP name to be unique.
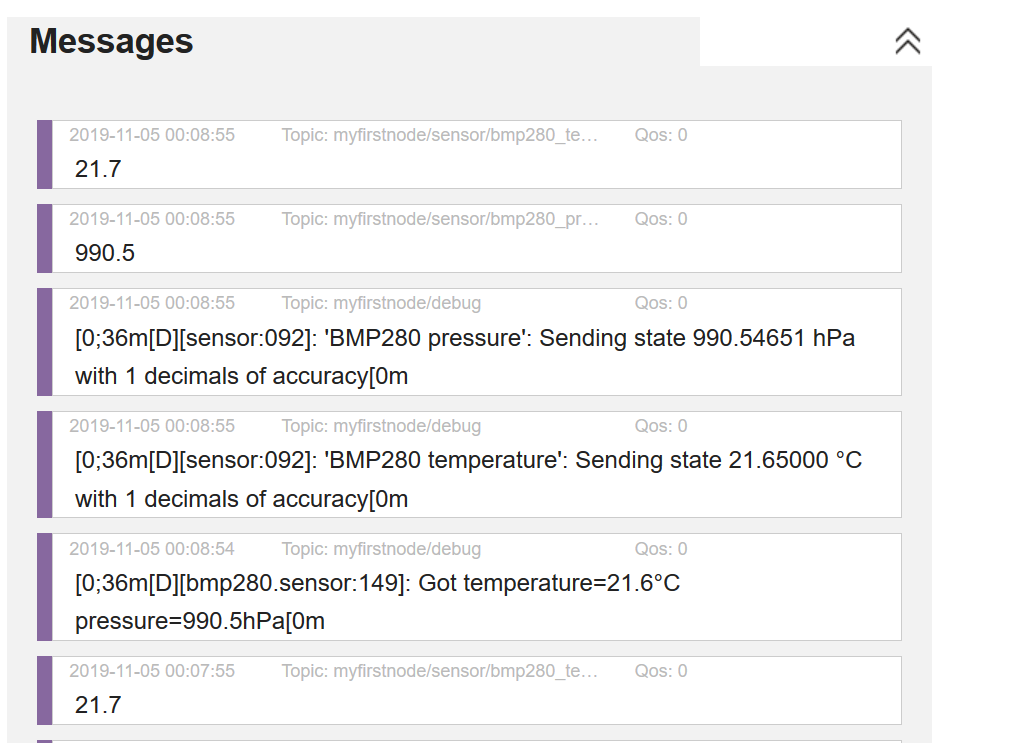
Now you can
go to http://www.hivemq.com/demos/websocket-client/ and ‘Add new Topic subscription’.
If you enter here the <name of your ESP>/# , all the messages from your
ESP will be shown:
NodeRed
Now we can
pick up this data in other platforms, like NodeRed
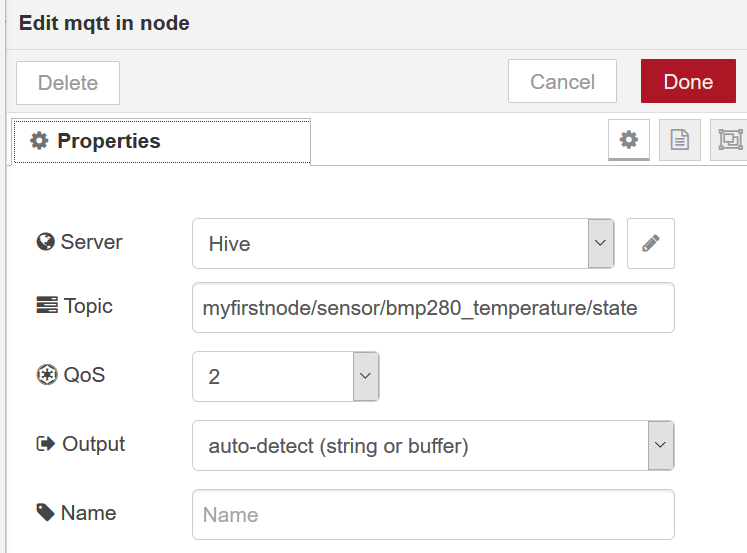
Add a MQTT
input node:
The topic
should start with your node name. The server should be broker.hivemq.com.
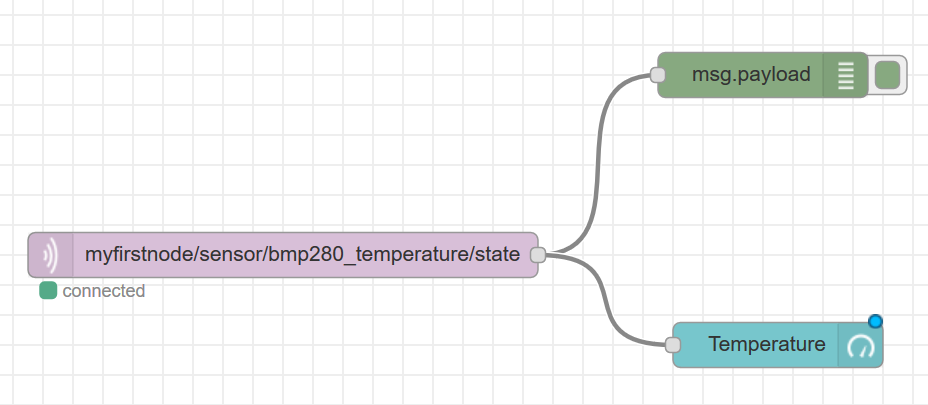
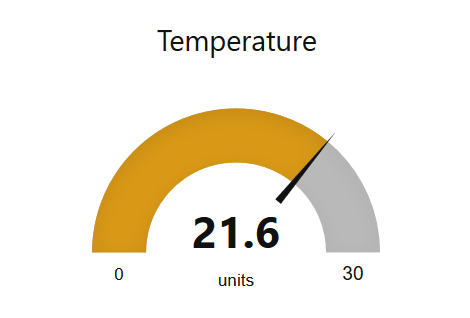
If you
connect a debug or gauge component, the value will be shown in your dashboard: